Learn tsmap
A wafer map is a picture of how a semiconductor wafer tested. This lesson gives you the few words you need to read one, then shows you where everything is on the screen.
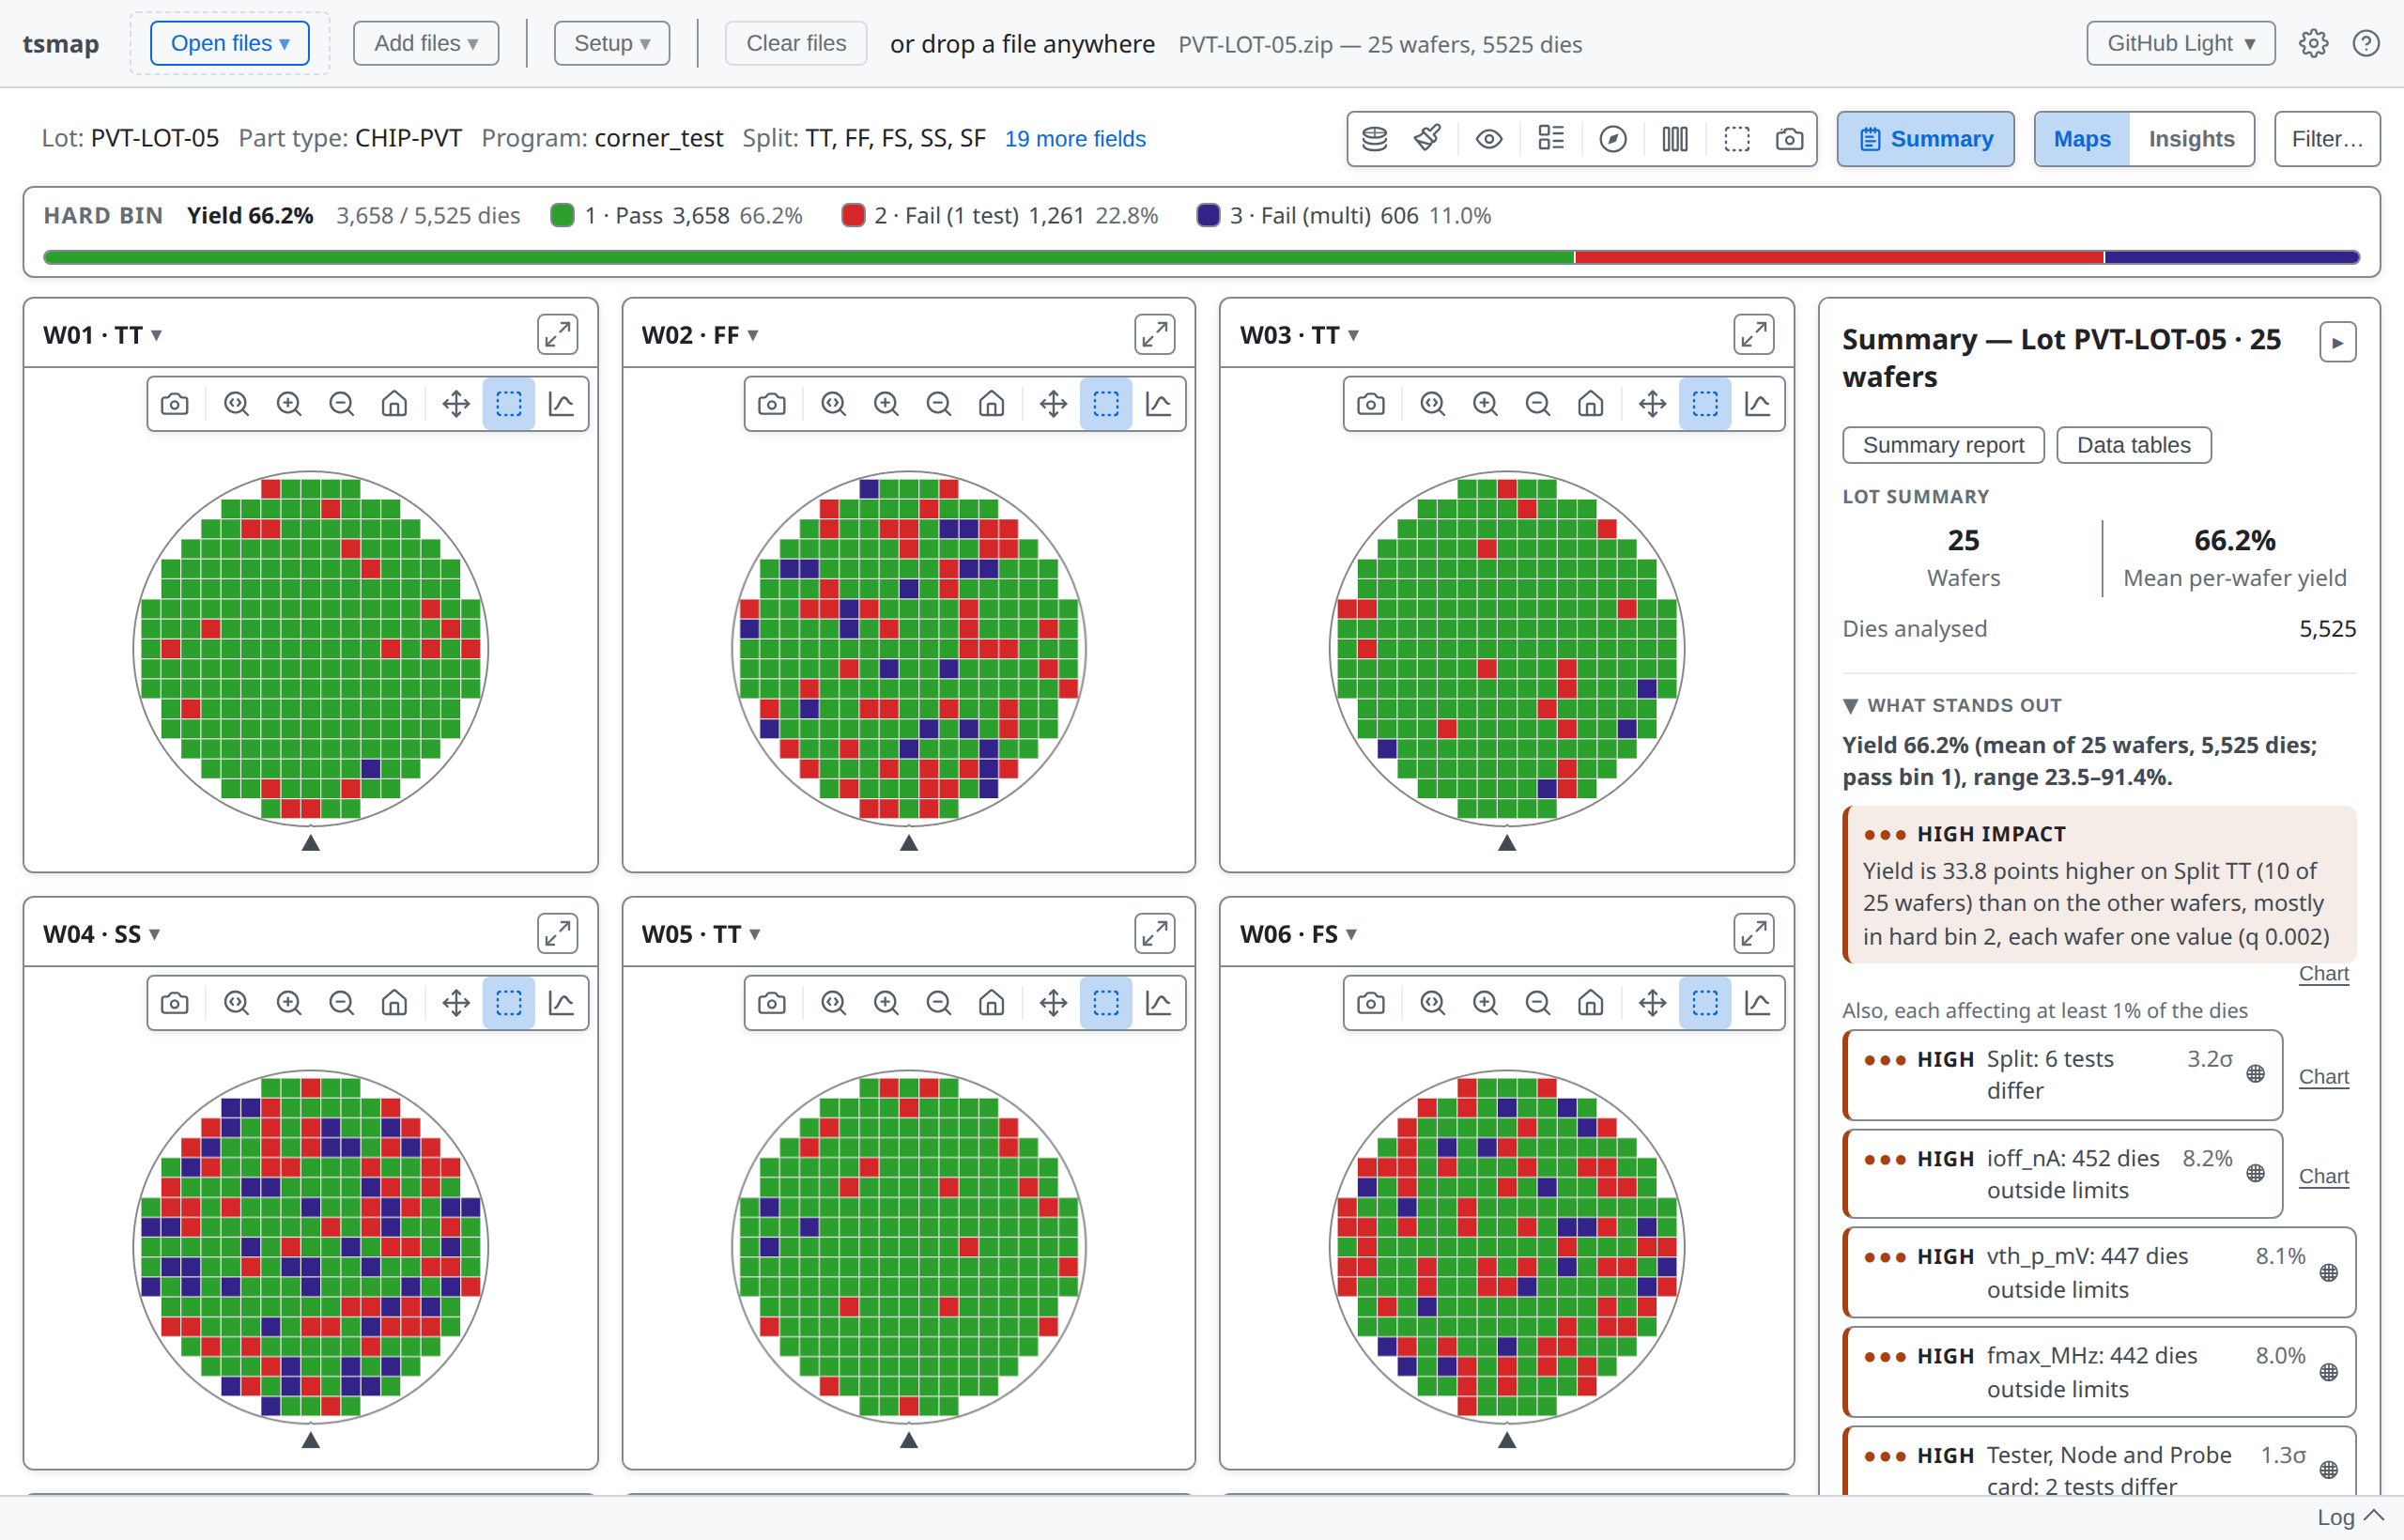
This is where you will end up: a lot of 25 wafers open in tsmap, with the bin legend, one map per wafer and a summary of what stands out. The rest of the lesson explains each part.
Four words come up on every screen.
A simple wafer map draws one rectangle for each die, so you can see where on the wafer the results are good or bad.
The tester records two kinds of test result for every die.
Testers usually write STDF (binary) or ATDF (text) files. Data can also arrive as CSV, JSON or Parquet files. tsmap reads all of these file formats, compressed or not.
After testing, every die is classed into a bin (a category), and the bins are what colour the map. There are two kinds of bin:
Yield is the share of dies in a pass bin: 66.2% for this lot, shown in the legend.
A map that is mostly green is a healthy wafer. The other colours show where the rest of the dies failed, and how.
Open STDF, ATDF, CSV, JSON or Parquet files and get interactive wafer maps, findings, charts and tables. You can start looking at your data straight away, with nothing to program.
The same test data parser, maps and charts run in both. Only the desktop app has:
tsmap://
More about this in the user guide
tsmap is built on wafermap, our own fast open-source library that draws the maps and charts and finds the patterns.
You do not need to know anything about wafermap to use tsmap.
These lessons link to two guides:
The main screen has eight areas. You will see them all numbered once, then described one at a time.
Load sample data opens a synthetic lot of 25 wafers, so you can follow along without any files of your own. Most labs in these lessons use it.
The app toolbar opens and adds files, sets up the lot and clears it. Lesson 01 covers loading.
The lot header shows the lot, part type, program and other fields read from the file.
The map toolbar controls what the maps show and how they look. Lesson 02 takes it button by button.
Maps and Insights switch between the wafer maps and the charts and statistics for the lot.
The bin legend shows how many dies fell into each bin, with the lot's yield first. Click any bin to display just that bin on the maps.
Each wafer gets its own wafer map. Click the ▾ beside its name to show the wafer's details.
The Summary panel shows what stands out in the lot, the findings, and the yield of every wafer.
The log records each data load, with any warnings. Click Log to open it.
The ? button opens the Help menu. User guide opens the full guide.
Maximize (F) and Close (Esc), top right, are on every dialog.
Press F to fill the window, and Esc to close it.
tsmap is quick to pick up. Load a file and you can start looking at it straight away, so you do not have to finish the lessons before using the app. They are there for when you want to go further.
You now know the words and where things are. The next lesson is about getting your own data in.
01 · Getting data in →
Opening your own files, choosing tests and mapping columns.