Learn tsmap
When one test moves, does another move with it? Knowing which tests travel together helps you find a shared cause, and spot a number that only looks like a link. This lesson shows how to read the matrix, and how to check a relationship before you trust it.
The matrix on the left shows the correlation between every pair of tests. The scatter on the right shows one pair, with a point for each die. Use the matrix to find a pair worth looking at, then the scatter to see it.
Each cell is r for two tests. Blue: they rise together; orange: one falls as the other rises. Stronger colour, stronger link. A link is not a cause, but it tells you where to look. 1 sets how many tests; 2 saves a table.
A matrix of many tests gets hard to read. You can set Max tests between 5 and 100 (default 20). The card counts pairs with |r| of 0.7 or more as strong and 0.4 to 0.7 as moderate. With five tests it finds 2 strong and 4 moderate.
Values colours each cell by r, how two tests' values move together. Fails together asks a different question: of the dies that fail either of two tests, what share fail both?
Read this view when you want to know which failures go together.
Click a cell and the scatter shows that pair, with r and n, the number of dies, above it. Here idsat_p_uA falls as vth_p_mV rises, r = −0.81, a strong link. Click a point to open its wafer's map.
idsat_p_uA
vth_p_mV
Log X and Log Y draw an axis on a log scale, which helps when values run over several orders of magnitude, such as leakage. Each is offered only while every value on that axis is above zero, because a log scale cannot show zero or a negative number.
The Bin 1, Bin 2 and Bin 3 buttons above the plot show or hide the dies of each bin. Click one to switch it off or on. This shows whether failing dies sit at one end of the relationship, which tells you whether the link has anything to do with yield.
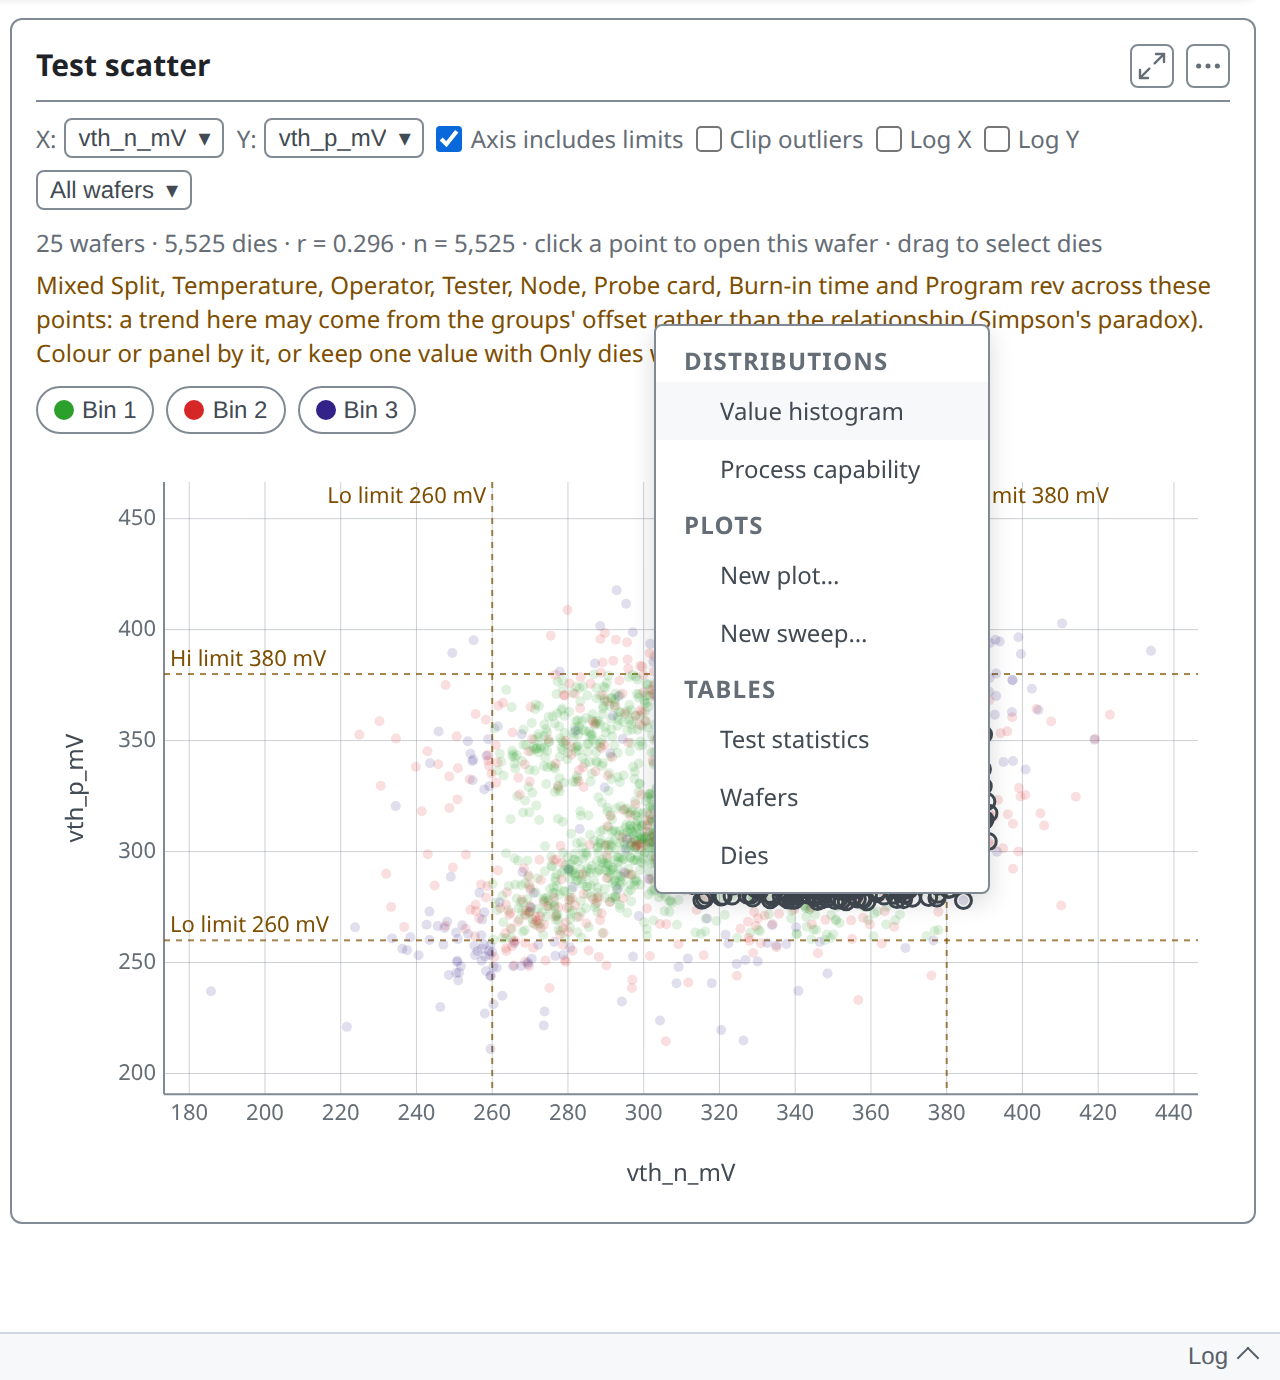
A strong r is not always real. Pooling splits can make a trend that is only the groups sitting at different levels, not a link inside each group (Simpson's paradox). The card warns when the dies mix a field, so you know to check.
The first check is to look at one wafer. The Wafer menu narrows the scatter to one wafer. The X and Y menus pick the tests, as the matrix cells do.
Looking at W07 alone, r is −0.564, not −0.81. Part of the pooled figure may come from the splits sitting at different levels. The warning is gone because only one wafer is left. The link is still there, but weaker than the pooled figure suggested.
The second check is to look at each group. With Group by on, the scatter colours the dies by group and draws a fitted line through each. If the lines sit apart but run parallel, the groups differ in level; if they run in different directions, the pair does not move together in the same way in every group.
You can run the same check on the whole matrix. With Group by on, it offers Pooled | Within Split. Pooled is the matrix you have seen. Within takes each group's own mean off every test first.
Compare the two views pair by pair.
You can also look at one group on its own. Group by → Split, then Show → TT: the matrix and scatter use only TT's dies. idsat_p_uA against vth_p_mV reads r = −0.41 inside TT, not −0.81 pooled. The link holds, but part of the pooled figure was the splits sitting at different levels.
To find out which dies sit at an extreme of the relationship, drag a rectangle over the scatter. The dies inside it, on any wafer, open the menu of charts and tables for just those dies.
(The same menu is the subject of lesson 08.)
vth_n_mV
idsat_n_uA
Next you will learn to filter and chart exactly the dies you care about.
More in the wafer map guide
08 · Drilling into any population →
Filter, select and chart just the dies you care about.