Your own plots and sweeps

Lesson 10

Learn tsmap

Learn tsmap · 10 Your own plots and sweeps

In this lesson

The charts in Insights answer the common questions. When yours is different, you can build the chart yourself. This lesson shows how to make a plot, keep it, and use it again on the next lot.

  • Build your own charts in the plot editor
  • Keep them, export them and reuse them on the next lot
  • Read a run of tests as a sweep curve
Learn tsmap · 10 Your own plots and sweeps

Plots

Learn tsmap · 10 Your own plots and sweeps

Examples

The quickest way to start is to look at examples. On the sample lot, the My plots | Examples switch shows one or the other, never both. Examples draws one plot of each chart type the lot can show, chosen from the lot's own data. Each is marked Example, because it is not yet yours. + New plot opens a scatter already set to the lot's first two tests.

The Examples view: each plot marked Example, with Add to my plots

Learn tsmap · 10 Your own plots and sweeps

Keeping examples

Add to my plots on one example keeps just that one, and its button then says In your plots. Add all keeps every example you do not have yet and takes you to My plots, with an Undo that removes only what it added. Under each plot, the how to read this link opens the guide section for that kind of chart.

My plots after Add all: a scatter with fit lines and a histogram by split

Learn tsmap · 10 Your own plots and sweeps

Edit, Duplicate, Delete

Each card has three buttons: Edit changes the plot, Duplicate copies it so you can try a variation, and Delete removes it. Delete can be undone straight afterwards. Changes in the editor are drawn at once and kept as you make them, so there is no save button to forget.

Learn tsmap · 10 Your own plots and sweeps

The plot editor

The editor has two pages. Setup chooses what the chart shows, and Customise how it looks. To go back, Reset undoes this visit's changes; Cancel undoes and closes; ✕ keeps them.

The plot editor on a new scatter plot

Learn tsmap · 10 Your own plots and sweeps

Chart types

Pick the type that matches your question. There are ten, and each takes different fields: a histogram takes one set of values, a box or bar takes categories. Sweep reads a run of tests as a response curve: choosing it swaps the fields for a series form (see Sweeps, at the end of this lesson), and choosing another type brings the plot's own fields back.

The Chart type buttons, with the histogram chosen

Learn tsmap · 10 Your own plots and sweeps

The everyday five

Type Shows
Scatter one field against another, a point per die or wafer
Histogram how often each value occurs
Box the spread in each category: middle half, median, extremes
Bar one value or count per category
Line a value in order, such as across wafers
Learn tsmap · 10 Your own plots and sweeps

Four for closer reading

Type Shows
Probability each group's values on a scale where a normal spread is a straight line
Control one value per wafer in order, with rule breaks marked
Heatmap a colour for every pair of two categories, such as tests by wafer
Goal each test placed by how off-centre and how wide it sits in its limits
Learn tsmap · 10 Your own plots and sweeps

X, Y and Colour

These three choose the data. Each opens a list of fields: any test, a die's position, ring, bin or site, a wafer's yield, or a wafer field such as split. Colour separates the data into groups, each with its own button above the chart.

The Colour list on a scatter plot

Learn tsmap · 10 Your own plots and sweeps

Colour by Split

Colouring by Split gives one colour per split. Follow Group by is the default: the colours follow the Group by control above the charts, so changing it once recolours every plot that is set to Follow Group by.

The scatter coloured by Split

Learn tsmap · 10 Your own plots and sweeps

Group by or Compare by

There are two ways to split the data, and they work at different levels.

  • Group by pools whole wafers by a wafer field, for every chart
  • A plot's Colour and Categories can also split dies: by ring, bin, site or a pass/fail test
  • A ring is never a Group by choice: every wafer has dies in every ring
Learn tsmap · 10 Your own plots and sweeps

More settings

The editor has more settings than you will need at first. These are the ones people reach for.

  • Filter: keep only the dies that meet conditions
  • Panels: one small plot per value of a field; a Columns control above them, or the keys 1 to 5 while the pointer is over the plot, sets how many sit side by side
  • Fit line: least squares, or orthogonal for two measures of one thing
  • One mark per: a point per die or per wafer
Learn tsmap · 10 Your own plots and sweeps

Many tests, many groups

For bigger questions, the editor can combine several tests or nest groups.

  • Several tests… puts a list or range of tests in one plot; Rescale values puts them on one scale (to limits, or as z-scores)
  • In ranges cuts a number into bands, such as Idsat deciles
  • + Add a level nests categories, such as wafers inside each split
Learn tsmap · 10 Your own plots and sweeps

Reading against limits and totals

A few settings help you judge data against a target.

  • What-if limits draw proposed limits on a histogram and say how many dies would change
  • Colours: stacked, 100%, or each colour's share, to compare groups of different sizes
  • Cumulative line turns a bar sorted largest first into a pareto
Learn tsmap · 10 Your own plots and sweeps

A plot's filter and the page filter

You can filter in two places, and they combine.

  • Filter… in the toolbar narrows every view, and is not saved with a plot
  • A plot's own Filter is saved with it and narrows that plot only
  • A plot shows the dies that pass both; neither changes the other
Learn tsmap · 10 Your own plots and sweeps

Customise

Customise changes how the chart looks without changing what it says. On the Customise page you can set titles, each axis's minimum and maximum, its Linear or Log scale, Reverse direction, reference lines, and which limits are drawn (Test + spec, Test, Spec or None).

The Customise page of the plot editor

Learn tsmap · 10 Your own plots and sweeps

The JSON tab

Beside Setup and Customise, JSON shows the same plot as text. This is how you share a plot: copy it, or paste one someone sent you. You can also edit it directly.

The editor's JSON tab, with the plot written out as text

Learn tsmap · 10 Your own plots and sweeps

Suggestions in the JSON

You do not have to remember the keys.

  • Suggestions open as you type, after a comma or a brace, or with Ctrl+Space
  • They offer the keys, the lot's tests and fields, and the values a field takes
  • A change is drawn at once, and Ctrl+Z undoes the last one
Learn tsmap · 10 Your own plots and sweeps

Reference lines

Reference lines mark your own target, guard band or customer limit on a value axis, to see how the data sits against a number that matters to you. In Customise, write a value or a lo..hi band, each with an optional name:

320 Target, 300..340 Window, median
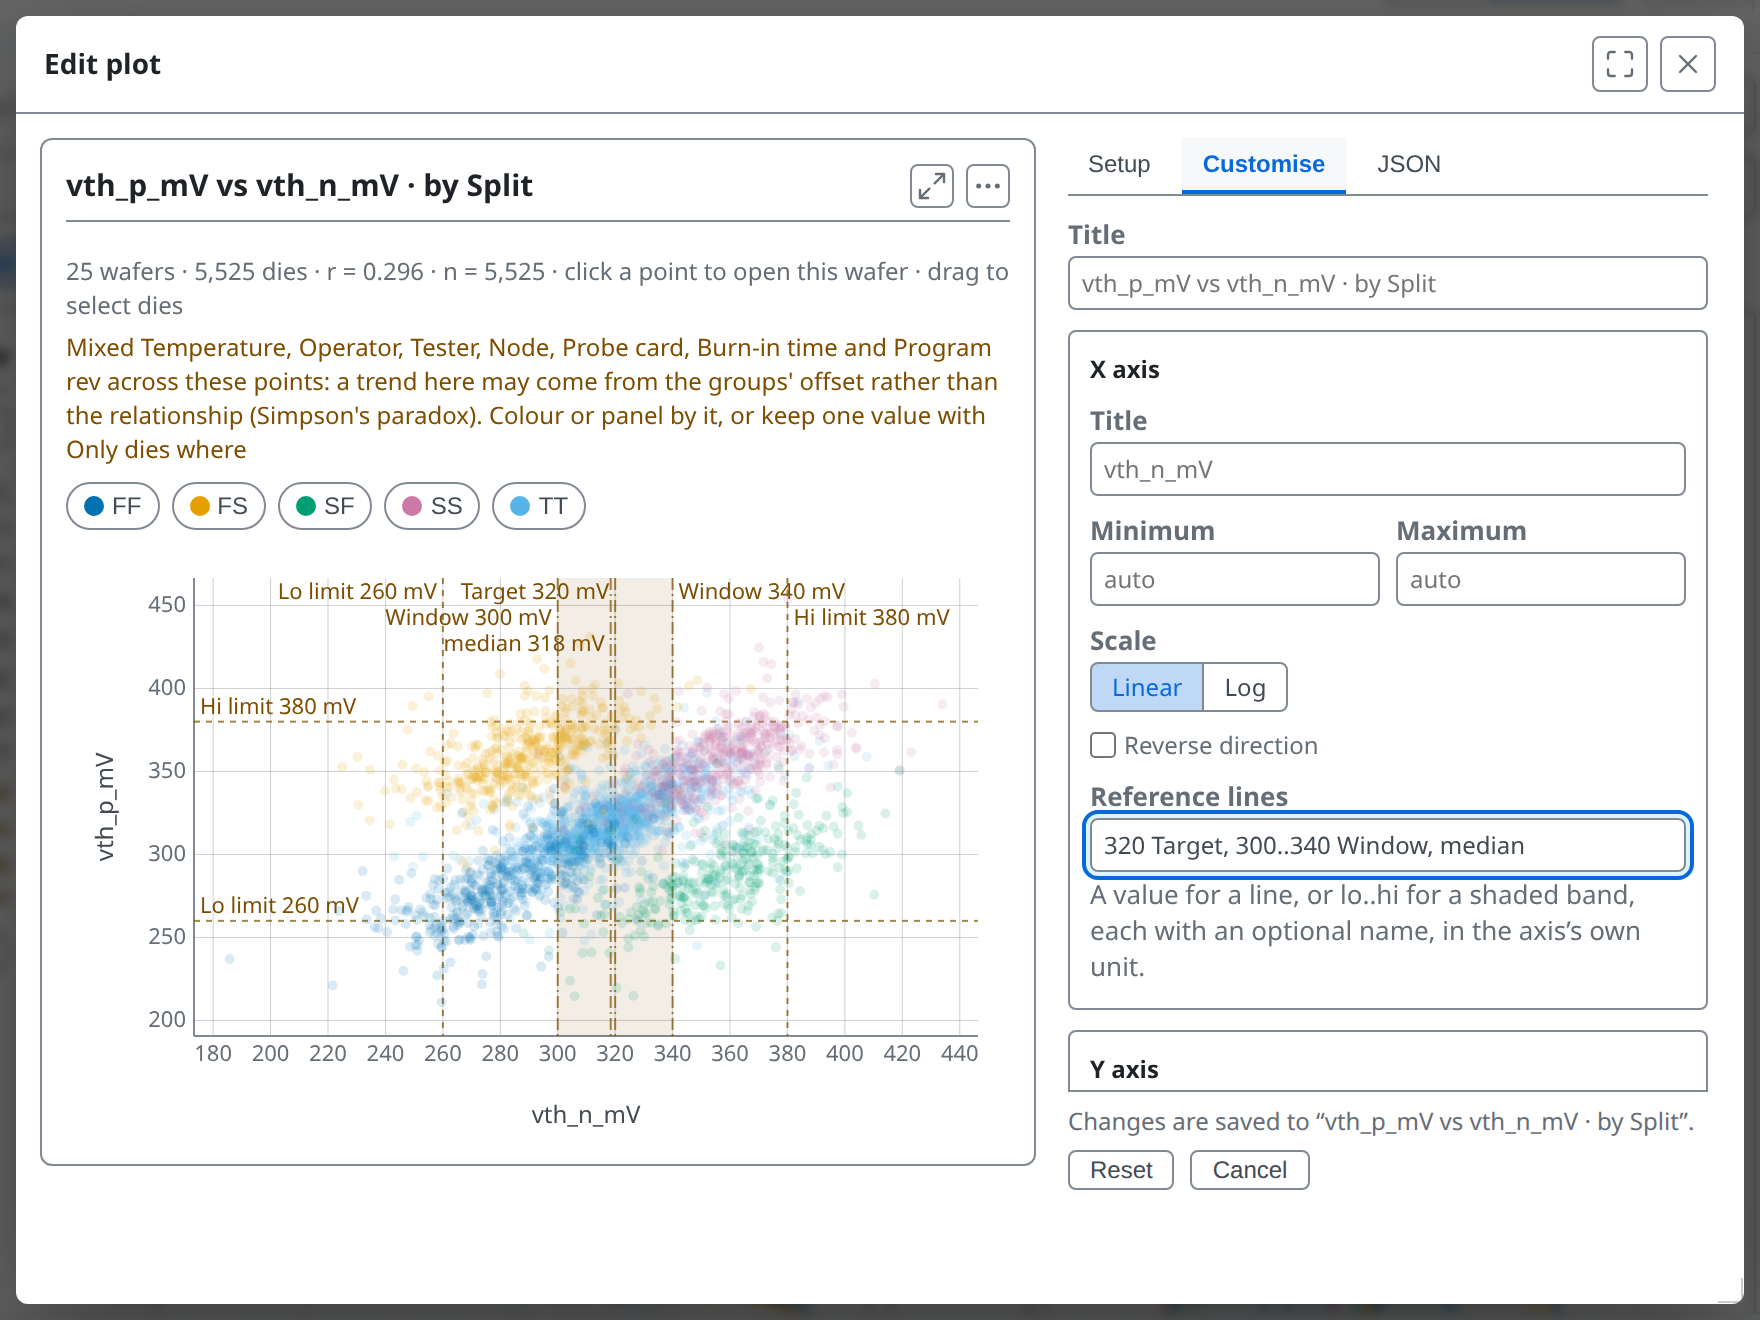
Customise with three reference lines written in the X axis field: a target, a shaded band and the median

Learn tsmap · 10 Your own plots and sweeps

Your plots are kept

You build a plot once. A plot is a recipe, not a picture, so tsmap keeps your plots and draws them again on the next lot. One that needs a test the new lot lacks stays, dimmed, with the reason, instead of silently disappearing.

The same plots on SWEEP-LOT-06: each stays, dimmed, with the tests or fields it needs and this lot lacks

Learn tsmap · 10 Your own plots and sweeps

Export, import, delete all

Export plots… writes every plot to a file and Import plots… adds the plots of such a file, so a set can move to a colleague or another machine. Delete all plots… asks first.

Delete all plots confirmation: how many, and to Export plots first

Learn tsmap · 10 Your own plots and sweeps

Undo

Right after deleting, Undo brings the whole list back.

My plots after deleting, with Undo outlined

Learn tsmap · 10 Your own plots and sweeps

From the right-click menu

You can also chart a selection with your own plots. Every saved plot is a row in the menu on a selection, drawn over just those dies. New plot… and New sweep… at the end of its Plots section start a draft on them.

The right-click menu with New plot… and New sweep… outlined

Learn tsmap · 10 Your own plots and sweeps

A draft

A draft is a trial. It is kept only if you press Add to my plots, and Cancel discards it.

A draft plot over one die selected on W02

Learn tsmap · 10 Your own plots and sweeps

Sweeps

Learn tsmap · 10 Your own plots and sweeps

A run of tests as a curve

Some test programs measure the same thing at a series of levels, such as a current at a run of voltages, with one test for each level. Read one test at a time, and the run is dozens of numbers. Read as a curve, it is one shape. The Sweep chart type draws that run of tests as one curve.

These slides use SWEEP-LOT-06 and its definitions file from lesson 09. Its plots file is on the sample files page.

Learn tsmap · 10 Your own plots and sweeps

Import plots…

Import plots… reads a plots file and adds its plots, which is a quick way to start from someone else's setup. SWEEP-LOT-06's plots file brings two sweeps. Each line is the median across the dies, with a shaded band from the 10th to the 90th percentile.

Two sweep cards: up/down switching, and endurance

Learn tsmap · 10 Your own plots and sweeps

What the card measures

  • A sweep card reports two results for its first two curves
  • Crossing is where they meet
  • Width is how far apart they are at the sweep's set levels (dashed lines)
  • On a log axis the width is a ratio, such as ×2.93

The Endurance sweep card, with its Crossing and Width readouts under the chart

Learn tsmap · 10 Your own plots and sweeps

The sweep editor

To build or change a sweep, press Edit. It opens the sweep beside a live copy of its curve, so you see the effect of each change. For each series, type its tests in sweep order, then say where each test's X comes from.

The sweep editor for the up/down switching sweep

Learn tsmap · 10 Your own plots and sweeps

From test name

Each test's X comes from its Test order, typed Values, or From test name: here the cycle count in "High-state I after 1e2 cycles". + Add series adds a curve.

The endurance sweep reading cycles from the test names

Learn tsmap · 10 Your own plots and sweeps

A sweep remembers its tests' names

A sweep is saved with the names of its tests. If a later lot uses the same test numbers for other measurements, the sweep does not draw them and says so on its card, instead of drawing another quantity as the same curve.

Learn tsmap · 10 Your own plots and sweeps

Try it yourself

  1. In the web app, Load sample data, then Insights → My plots → Examples → Add all
  2. Edit the first plot and set Chart type to Box
  3. Set X axis to Split: which split differs most?
  4. Open Customise and put a reference line on the value axis
  5. Export plots…, then Delete all plots… and Undo
  6. Open SWEEP-LOT-06, load its definitions as in lesson 09, then My plots → Import plots… and choose tsmap-sweep-plots.json. Edit the Endurance plot and read where its X values come from
Learn tsmap · 10 Your own plots and sweeps

Check your results

  1. FF and SS sit furthest apart, at opposite ends, with TT between them. FS and SF fall between, depending on the test.
  2. The X values come from From test name: each test's name carries its cycle count, as in "High-state I after 1e2 cycles".
Learn tsmap · 10 Your own plots and sweeps

Recap

  • My plots are recipes, redrawn on the next lot
  • The editor offers ten chart types, Sweep among them; X, Y and Colour take tests, die fields or wafer fields
  • Export plots… keeps a copy; Undo brings back a delete for ten seconds
  • A sweep reads a run of tests as a curve and measures where two curves cross

Next, the wafers that do not look like the usual ones.

More in the wafer map guide

Learn tsmap · 10 Your own plots and sweeps

Next lesson

11 · Unusual wafers →

Multi-project wafers, no positions, retests and multi-site testing.

Learn tsmap · 10 Your own plots and sweeps