Reading a map and the toolbar

Lesson 02

Learn tsmap

Learn tsmap · 02 Reading a map

In this lesson

A map only helps if you know what its colours mean and can change them to answer your question. This lesson covers what the toolbar changes and how to look closely at a single wafer.

  • Open one wafer, then a whole lot
  • Change what the maps show: bins or a test's values
  • Add overlays, turn the wafer, zoom in and read a single die
Learn tsmap · 02 Reading a map

One wafer on its own

A file that holds a single wafer

Learn tsmap · 02 Reading a map

One map

A file with one wafer opens as one full-size map, with the Summary panel open beside it. This is EDGE-LOT-01's first wafer.

One wafer: the map, its legend and the Summary panel

Learn tsmap · 02 Reading a map

One toolbar

The toolbar has four groups, and each does one job.

  • 1 Save, zoom, pan, select and chart this map
  • 2 What it shows and how it looks
  • 3 Expand (E): F maximises, Esc closes
  • 4 Map | Insights

The one-wafer toolbar, its four groups numbered

Learn tsmap · 02 Reading a map

Insights for one wafer

Insights on a single wafer has the same tabs, over this wafer's dies. There is no Group by: one wafer has nothing to group.

Insights on one wafer: the tabs with no Group by

Learn tsmap · 02 Reading a map

What needs several wafers

One wafer has nothing to stack, group or compare, so these appear only for a lot:

  • the stacked plot modes, Columns and Select the same dies (lesson 04)
  • the Summary panel's Wafer Yield list (lesson 03)
  • in Insights, Group by, What divides yield and the comparisons (lessons 05 and 06)
Learn tsmap · 02 Reading a map

What the map shows

Learn tsmap · 02 Reading a map

The gallery toolbar

Several wafers open as a gallery, one card per wafer. Every button here acts on all of them at once, so the wafers stay comparable. The camera saves the whole gallery as one PNG.

The gallery toolbar

Learn tsmap · 02 Reading a map

Plot mode

This is the button you will use most. It decides what the colours mean: each die's hard bin, its soft bin, or one test's value. The stacked modes come in lesson 04, PAT verdict in lesson 05.

The Plot mode menu

Learn tsmap · 02 Reading a map

Soft Bin

Soft Bin colours each die by the test program's failure category, with its own legend. Use it when a hard bin is too coarse to tell you why dies failed.

The sample lot in Soft Bin mode

Learn tsmap · 02 Reading a map

Test Value

Test Value colours each die by its reading, so you see how a measurement varies across the wafer. ▽ and △ mark dies below and above the test limits.

W04 · SS coloured by fmax_MHz

Learn tsmap · 02 Reading a map

Two more buttons for values

In Test Value mode two more buttons appear: 1 Log scale. 2 Colour bar range: the test limits, the same on every wafer, or the data's own range.

The gallery in Test Value mode, with its two extra buttons outlined

Learn tsmap · 02 Reading a map

Two kinds of limit

A test can have two sets of limits, and they answer different questions.

  • Test limits are what the tester judged each die by: they decide pass or fail
  • Spec limits are the process specification: capability is measured against them when a test has both
  • Charts draw test limits with short dashes and spec limits with long ones
Learn tsmap · 02 Reading a map

Pass or fail, two ways

Sometimes you want to see which dies passed a test rather than its raw reading. In Test Value mode Overlays adds 1 Limit pass/fail, judged by the test limits, and 2 Test pass/fail, the verdict the tester recorded.

The Overlays menu in Test Value mode

Learn tsmap · 02 Reading a map

Limit pass/fail

Limit pass/fail shows dies inside the limits in green, below the low limit in blue and above the high limit in red, each with its count.

W04 · SS in Limit pass/fail

Learn tsmap · 02 Reading a map

Test pass/fail

Test pass/fail shows the tester's own verdict. It can differ from the limits, and guard bands are one reason, so it is worth a look when the two maps disagree. A functional test always shows this way.

W04 · SS in Test pass/fail

Learn tsmap · 02 Reading a map

Setting limits yourself

Some test programs ship without limits, or with limits that are not the ones you want to judge by. In the test selector (Setup ▾ → Tests…), Edit limits… opens a table of every test: its name, test limits, spec limits, validity limits, units and type.

Validity limits mark a reading as a tester clamp rather than a measurement. Lesson 11 uses them.
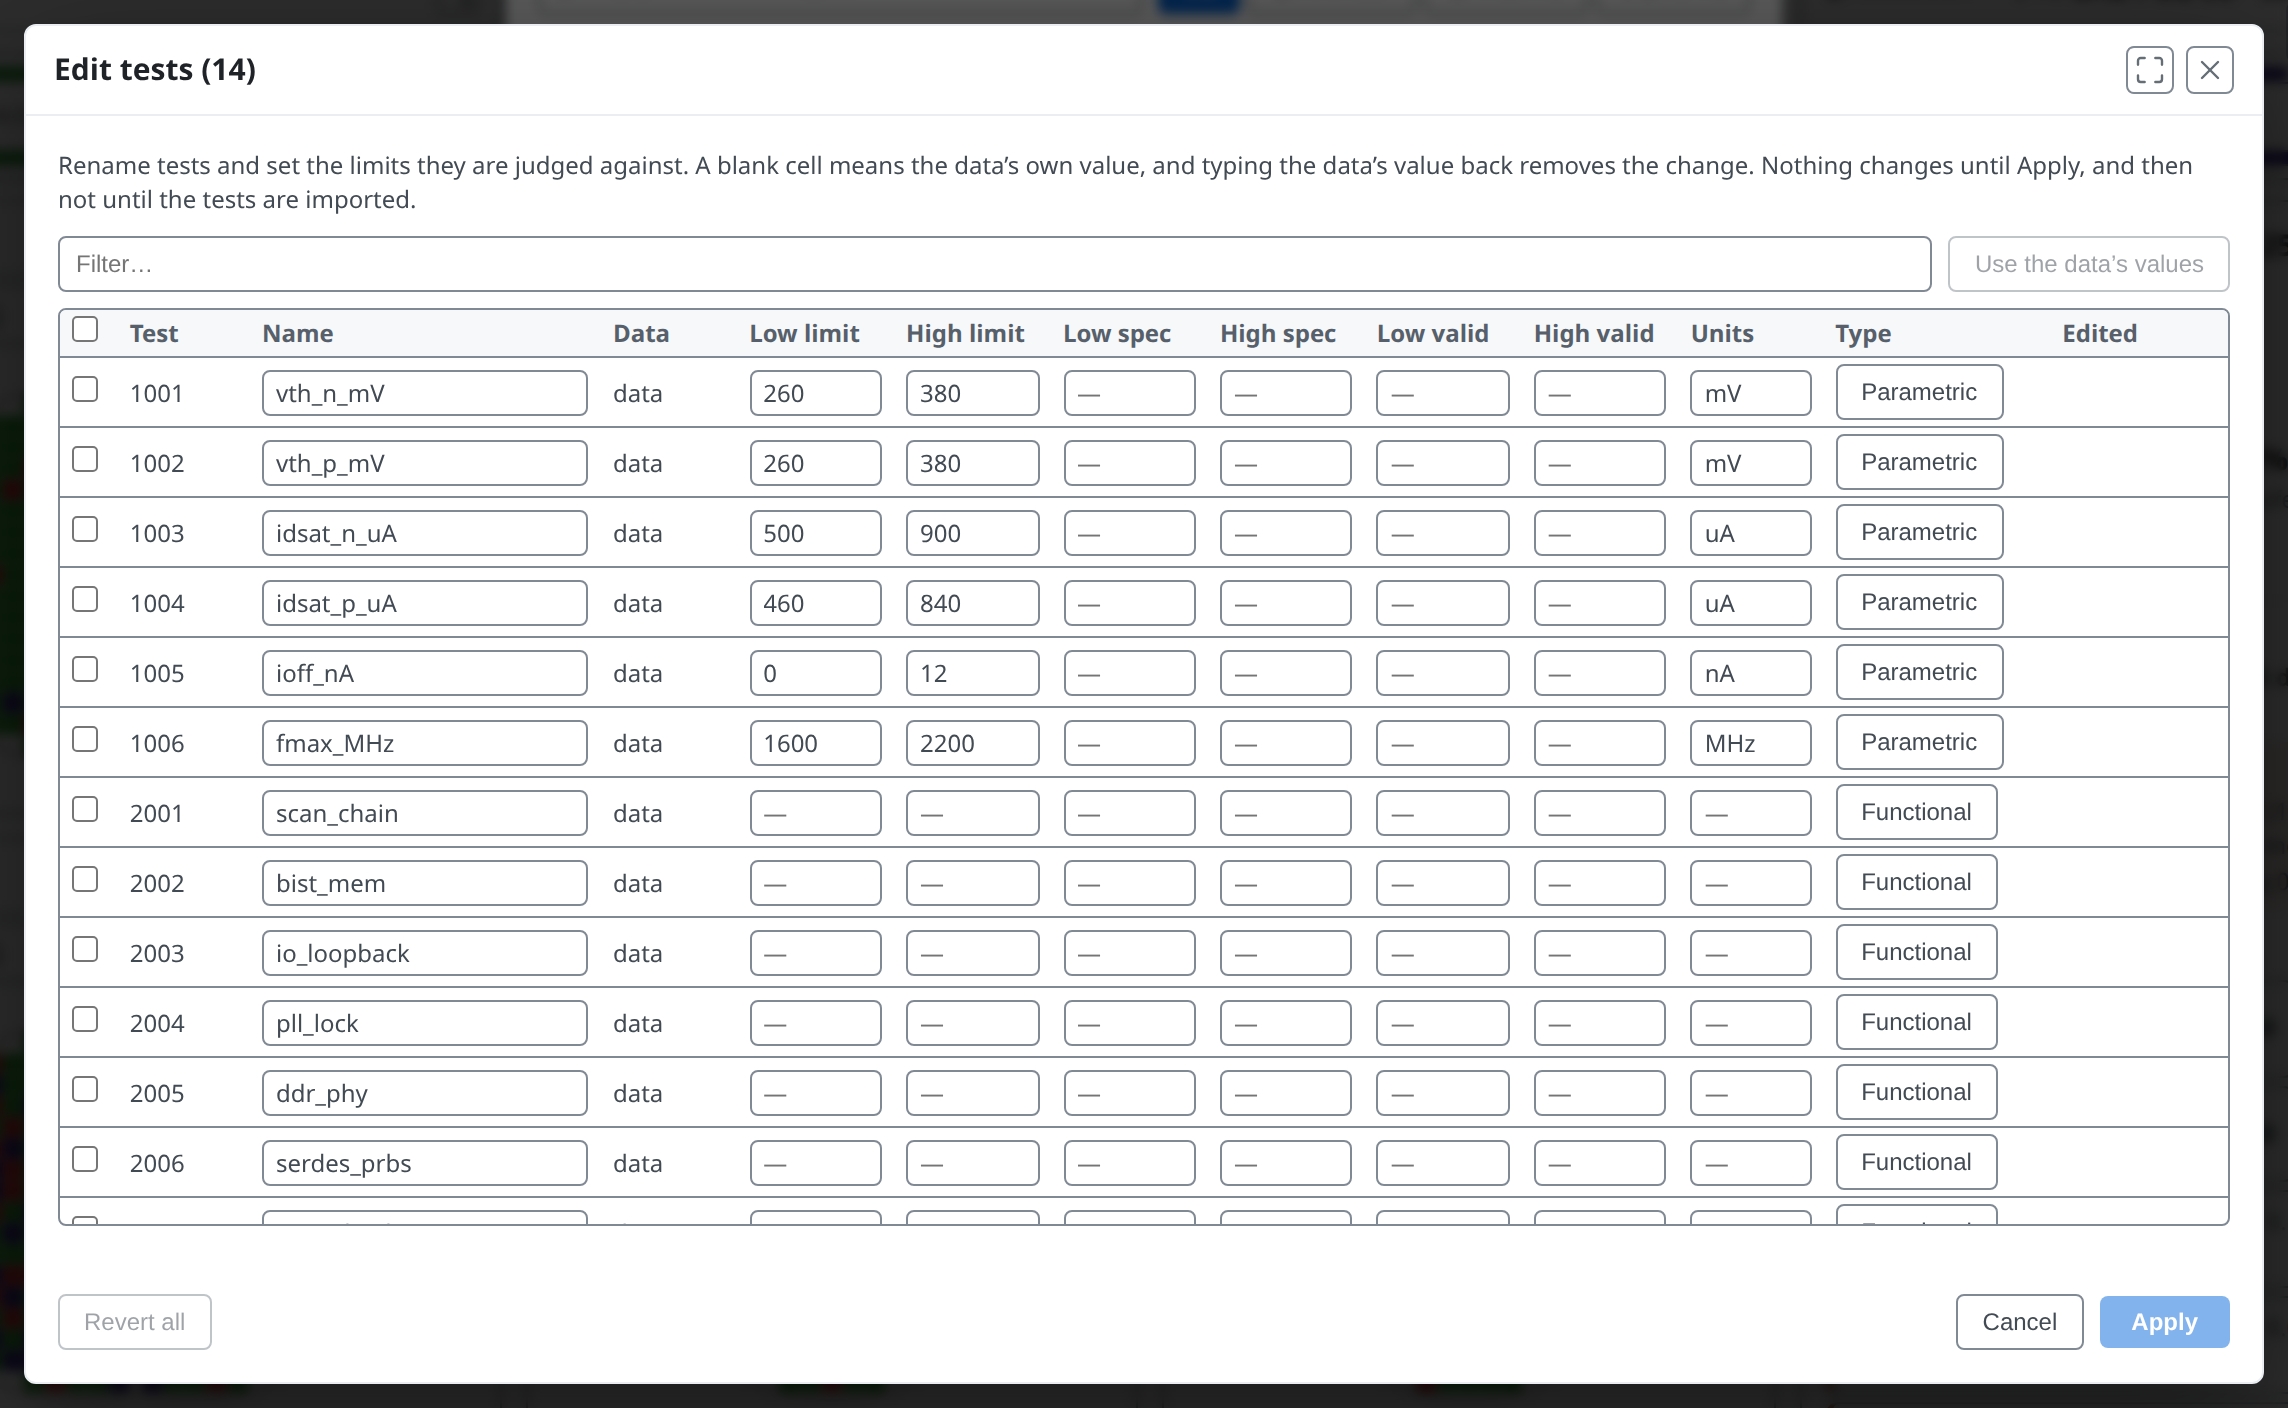
The Edit tests table for the sample lot: test limits and units, and no spec limits yet

Learn tsmap · 02 Reading a map

Change a limit

Type into a cell to change it. 1 The Data column then reads changed and the row gets a Revert button. 2 Apply counts the edited rows.

The first row with a new high limit, marked changed, and Apply (1 edited)

Learn tsmap · 02 Reading a map

The rules of the table

  • A blank cell means the data's own value: an edit can change a limit but cannot remove one the data states
  • Use the data's values discards the changes on the rows you have ticked, and Revert all discards every change
  • Units that differ only by an SI prefix, such as mV for V, convert the limits you give to the data's unit
  • Functional tests are pass/fail only, so their limits are ignored
Learn tsmap · 02 Reading a map

A limit that cannot be right

A low limit above its high limit is refused when you press Apply, with the test named.

Nothing changes in the lot until you press Apply to N tests → in the selector and the tests are imported. Save definitions then keeps your limits in a file for the next lot of the same program.

The table refusing a low limit of 2000 above a high limit of 1000

Learn tsmap · 02 Reading a map

Colour scheme

Choose default or colour-blind safe bin colours. Passing bins are always shades of green, so a pass looks like a pass whichever you pick. In Test Value mode the same menu picks the value colours, and Reverse gradient flips them.

The Colour scheme menu

Learn tsmap · 02 Reading a map

Highlight a bin

To follow one bin across the whole lot, click it in the legend. The others grey out, so you see at once whether it sits at the edge, in a corner or everywhere. Ctrl or Cmd + click adds more bins. Click the bin again to clear it.

Bin 2 highlighted across the lot

Learn tsmap · 02 Reading a map

Overlays and orientation

Learn tsmap · 02 Reading a map

Overlays

Overlays are layers drawn over every map, to help you read position. Clear overlays turns them all off, and is greyed when none are on.

The Overlays menu

Learn tsmap · 02 Reading a map

Rings and quadrants

Ring boundaries match the zones the findings use, so you can see what a finding such as "outer ring" refers to. Quadrant lines split the wafer into NE, NW, SE and SW.

W01 with ring boundaries and quadrant lines

Learn tsmap · 02 Reading a map

Orientation

Rotate or flip how the wafer is drawn, to match the way you are used to seeing it, such as with the notch at the bottom. Die coordinates never change, so a die keeps its address however the wafer is turned.

The Orientation menu

Learn tsmap · 02 Reading a map

Turned to your convention

Once the wafer is turned, the XY indicator is shown too. Reset orientation goes back to the start.

W01 rotated 90° clockwise, with the XY indicator

Learn tsmap · 02 Reading a map

Legend style

Legend on each map adds a legend to every card, then lets you choose where it sits.

The Legend style menu

Learn tsmap · 02 Reading a map

Columns

Auto fits as many cards as keep each die at least 6 pixels across, so a dense wafer gets a wider card. A number divides the width between that many cards. With the pointer over the gallery, the keys 1 to 5 set the columns and 0 returns to Auto.

Try it on PARAM-LOT-02, twelve wafers of 2,709 dies each: with few columns the dies are big enough to aim at; with five they are not.

The Columns menu

Learn tsmap · 02 Reading a map

One wafer close up

Learn tsmap · 02 Reading a map

Each wafer's toolbar

  • 1 Save this map as a PNG
  • 2 Zoom to a region, in, out, reset
  • 3 Pan  4 Select dies (lesson 08)

A wafer card's toolbar

Learn tsmap · 02 Reading a map

Zoom in

The wheel zooms at the cursor; hold Space and drag to pan. Click a map first and Ctrl + / − / 0 zoom it; anywhere else they scale the whole window.

W01 zoomed in two steps

Learn tsmap · 02 Reading a map

Read one die

Hover a die for its coordinates, bins, site and part ID. Coordinates are the prober's grid steps, the same however the wafer is turned.

The tooltip for one die on W01

Learn tsmap · 02 Reading a map

The wafer's details

The ▾ beside a wafer's name lists everything the file says about that wafer.

W01's details, expanded

Learn tsmap · 02 Reading a map

Reading the colours

Not every unusual colour means a failure.

  • Grey is no result for that die: not a fail
  • Dimmed at the rim is the edge exclusion; faded is a die a filter drops (lessons 08 and 11)
  • The legend lists pass bins first, then failing bins from the most dies down
Learn tsmap · 02 Reading a map

When the map warns you

tsmap tells you when something about a map needs care. A ⚠ or ⛔ button appears in the toolbar only when there is something to report. ⛔ means dies may not sit where they appear, usually because the wafer size was guessed. ⚠ means something was skipped, but what is drawn is right. Click it to read why.

Learn tsmap · 02 Reading a map

Try it yourself

  1. Open the single wafer and find the toolbar's four groups
  2. Clear files, then Load sample data
  3. Plot mode → Test Value → fmax_MHz: which split reads lowest?
  4. Overlays → Ring boundaries, then back to Hard Bin
  5. Zoom into W04 · SS and hover a failing die
Learn tsmap · 02 Reading a map

Check your results

  1. SS reads lowest: its mean fmax_MHz is about 1630 MHz, against about 1800 for TT and 1970 for FF. SS is the slow corner.
Learn tsmap · 02 Reading a map

Recap

  • Plot mode picks bins or a test; the legend highlights one bin
  • Overlays and Orientation change how every map is drawn
  • Each card zooms, pans and saves on its own

You can now ask the map a question by choosing what it colours, and read the answer die by die. Next, see what tsmap finds without being asked.

More in the wafer map guide

Learn tsmap · 02 Reading a map

Next lesson

03 · Findings →

What tsmap noticed in the lot, and how to read it.

Learn tsmap · 02 Reading a map