Findings

Lesson 03

Learn tsmap

Learn tsmap · 03 Findings

In this lesson

You have loaded a lot and want to know what is wrong with it. tsmap has already looked, and this lesson shows you how to read what it found.

  • Read What stands out, and show any row on the map
  • Read the Findings list and the patterns behind it
  • Use the Summary panel's tables and reports
Learn tsmap · 03 Findings

The headline items

Learn tsmap · 03 Findings

The Summary panel

This is the best place to start. The panel docks beside the maps and describes the whole lot you are looking at, so you can see what stands out before you open a single wafer. Applying a Filter… narrows it to the dies that are kept.

The Summary panel for the sample lot

Learn tsmap · 03 Findings

Open and close it

1 Summary opens and closes the panel. The ▸ at the end of the panel's title closes it too.

The Summary button in the row above the maps

Learn tsmap · 03 Findings

What stands out

The section opens with the yield as its headline. Below it are the items that cost the lot the most dies, largest first, so the top item is the first one worth looking into.

What stands out: the headline and the top item

Learn tsmap · 03 Findings

An item about groups of wafers

An item can compare groups of wafers, not just look at dies. 1 is the lot's yield. 2 says that wafers with split TT yield 33.8 points more than the other wafers, and that the loss is mostly in hard bin 2. Each wafer counts as one value, so the figure is about wafers, not dies.

The headline and the top item, numbered

Learn tsmap · 03 Findings

Why it has no buttons

An item about groups of wafers has no single place on the map, so it has no buttons, and clicking it shows nothing. Its Chart link opens a bar of yield for each group.

Learn tsmap · 03 Findings

Fields that move together

The lot's other fields are compared the same way. When two fields give the same groups, such as a tester and its probe card, tsmap names them together. It does not pick one for you; you choose which to follow.

Learn tsmap · 03 Findings

Every row shows the affected dies

Click a row and the map shows which dies it is about. You can then see for yourself whether the problem sits at the edge, in one corner or all over the wafer. Click the row again to clear it.

The map after clicking the ioff_nA row

Learn tsmap · 03 Findings

Losses and signals

Each item is one of two kinds, and they call for different questions.

  • A loss costs dies: a weak region, a low wafer, a failing test. Ask where the dies went.
  • A signal moves values or compares groups, such as a split shift. A shift in a test will not show in yield, but it may still matter.

The dots and word beside an item are its impact: the share of the lot it affects. Read the impact first, to see how much an item matters.

Learn tsmap · 03 Findings

Chart links

When you want the numbers behind an item, Chart opens Insights at this item's card, under Worth a look. The top item here is a difference in yield between splits, so its link opens What divides yield, the table that compares groups of wafers. (Insights is covered in lessons 05 and 06.)

The Chart link on the top item

Learn tsmap · 03 Findings

Full report

Full report ▸ at the foot of the section opens the report, which begins with the same items. The Summary report button at the top of the panel opens the same report.

The sample lot mixes test programs, so its report has one section for each group. The first section holds only that group's wafers.
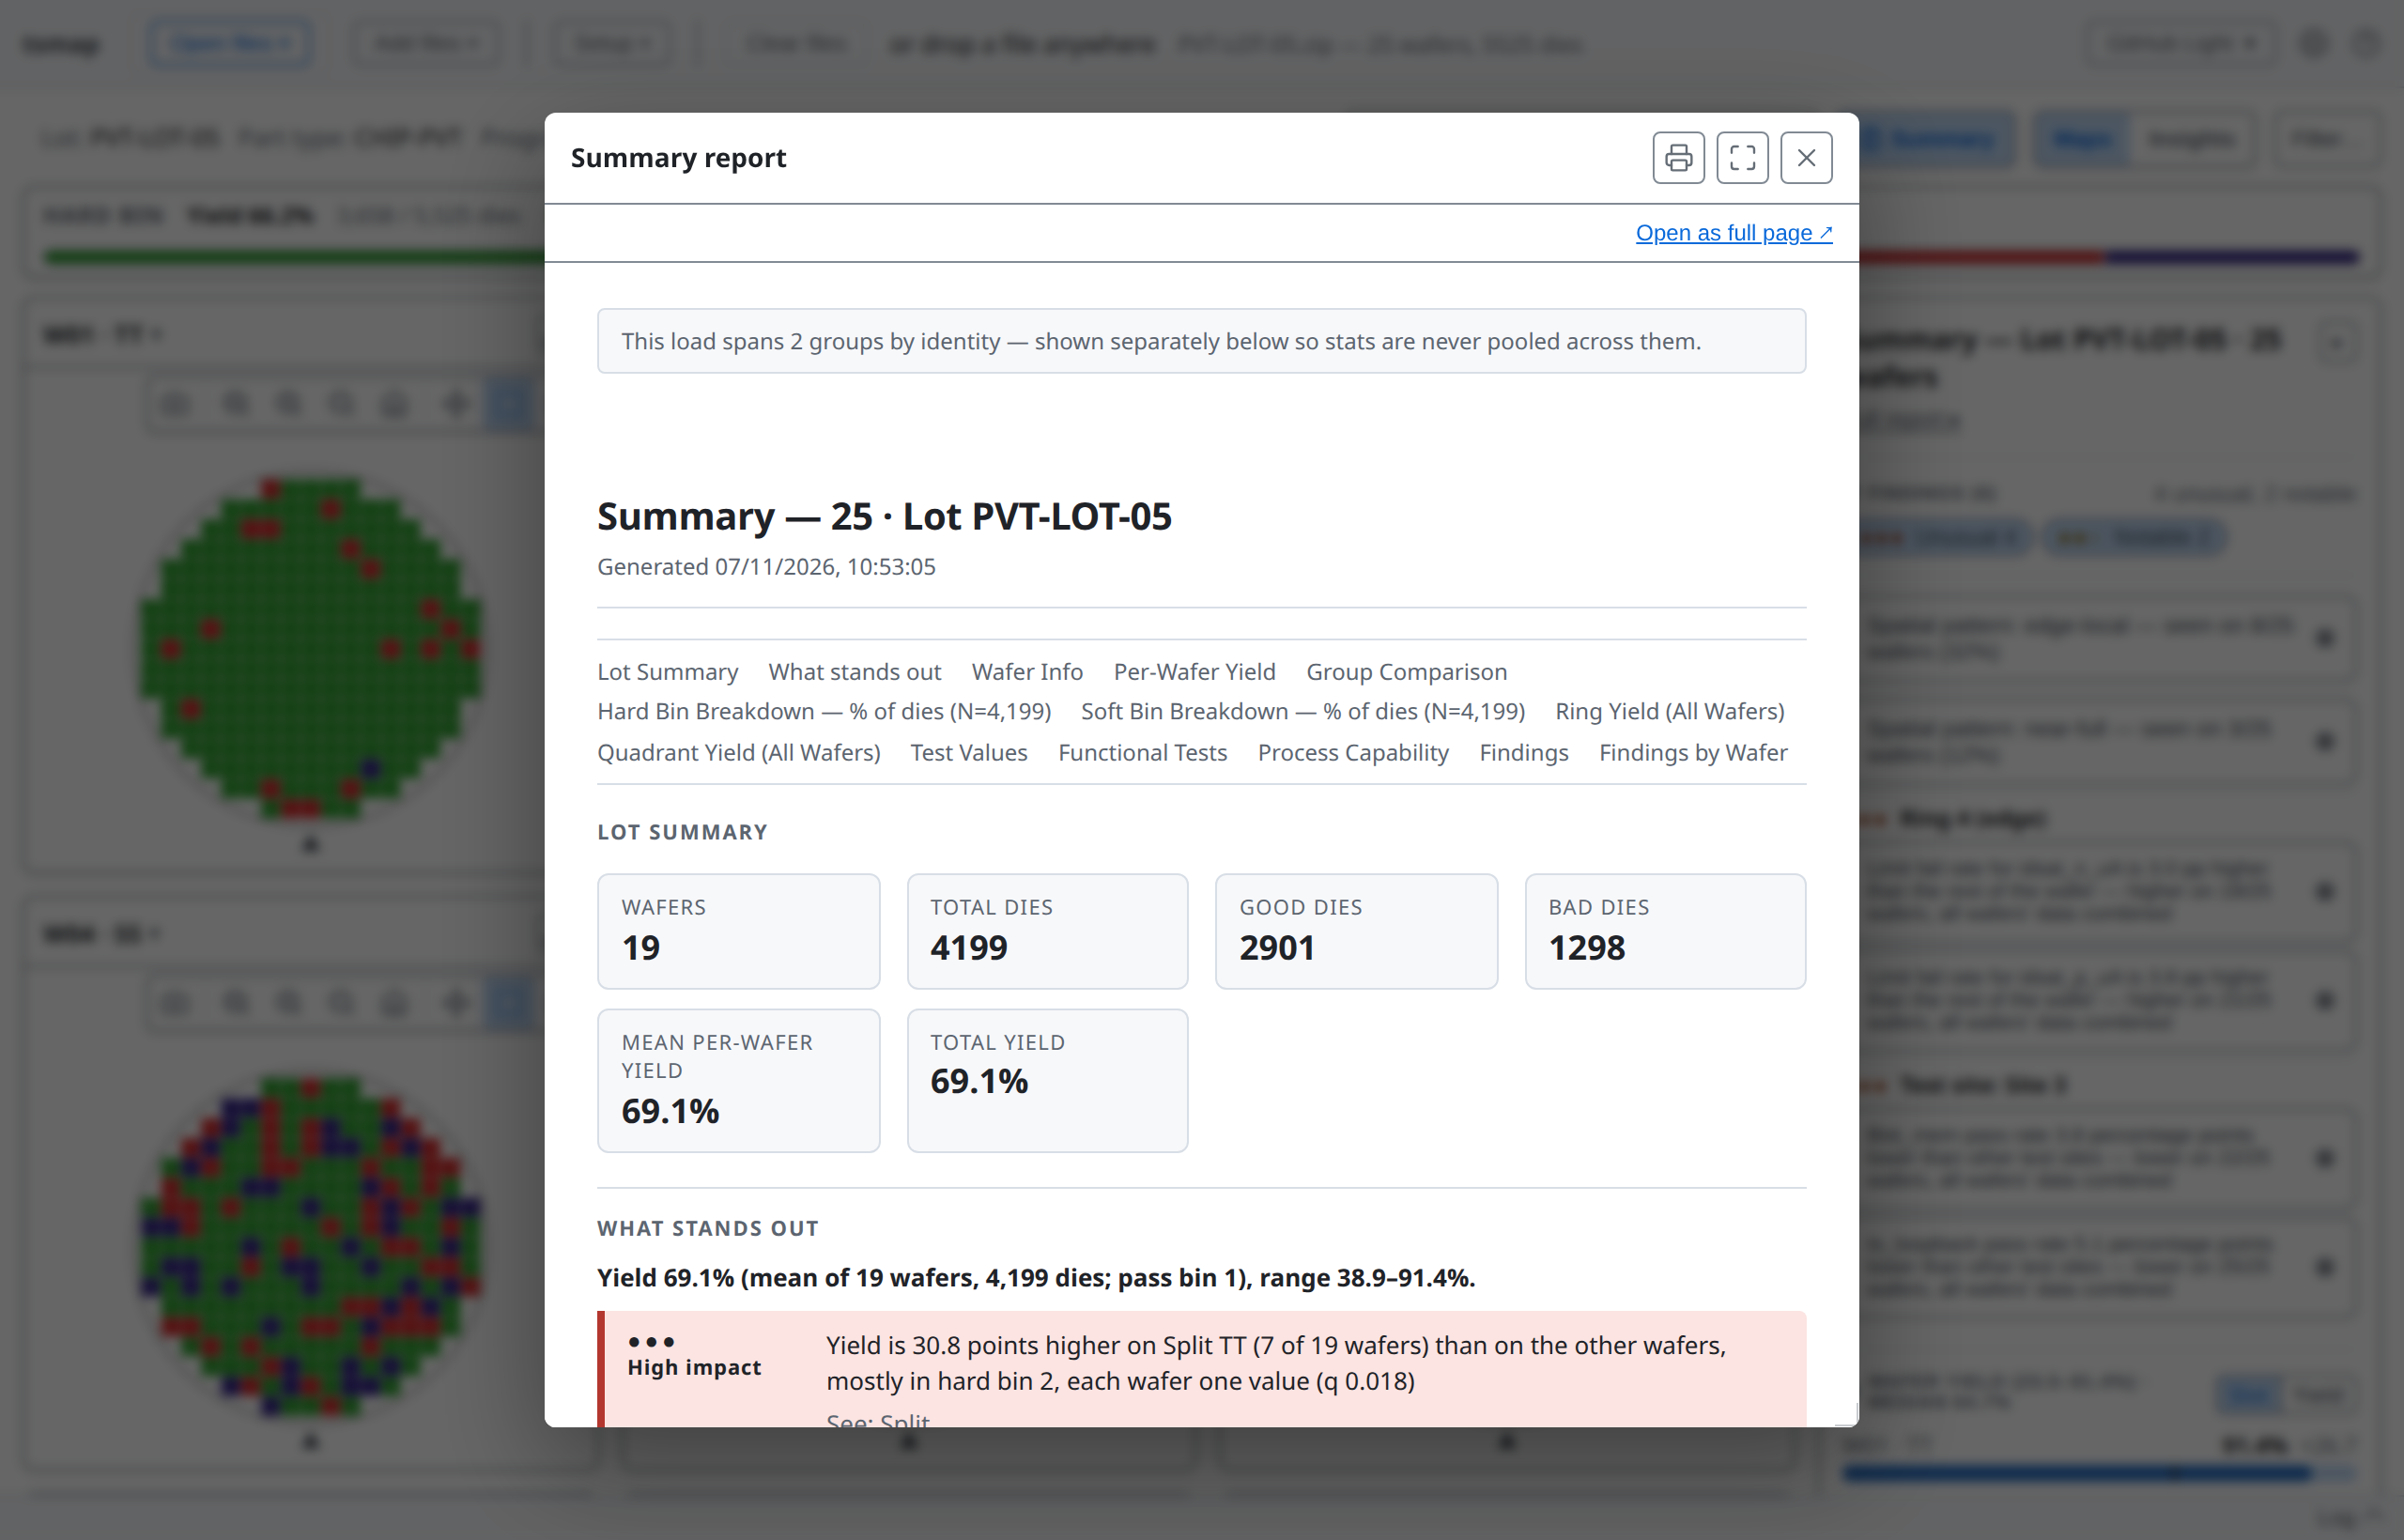
The Summary report, opened from Full report

Learn tsmap · 03 Findings

A lot with nothing to report

A lot with nothing to report is a result too. When no region, bin or wafer costs about a yield point, the panel says so and lists what it compared, so you know it looked. This is HY-LOT-04.

What stands out for HY-LOT-04

Learn tsmap · 03 Findings

Bigger lots

Checks on test values, such as a region reading high, take longer, so they run on their own only for small loads. On a larger one the Findings list says so, and Analyse adds them for every wafer.

More in the user guide

Learn tsmap · 03 Findings

The Findings list

Learn tsmap · 03 Findings

The Findings section

The list holds everything tsmap noticed, ranked by severity: Unusual, Notable or Minor. Severity is how strong the evidence is, not how many dies it costs. Use it to decide what to check first, and use impact to judge how much it matters.

The Findings section of the sample lot

Learn tsmap · 03 Findings

Narrow the list

The Unusual and Notable buttons narrow the list. Click a finding to show it on the map.

Learn tsmap · 03 Findings

What tsmap looks for

tsmap compares each part of the lot with the rest, and checks the failing dies for shapes it recognises.

  • Regions: rings, quadrants, finer sectors, and test sites that yield or read differently
  • Clusters of failing dies, and edge arcs at the rim
  • Spatial patterns such as a donut, scratch or centre spot
  • Reticle positions, once a reticle is set (lesson 11)
Learn tsmap · 03 Findings

A pattern and what backs it

A spatial pattern is a shape tsmap recognises in the failing dies. It can have a Show N supporting findings line, which holds the smaller findings that add up to it. This is EDGE-LOT-01.

A spatial pattern with its supporting findings closed

Learn tsmap · 03 Findings

The supporting findings

When opened, the line lists the regional findings the pattern explains. You read one pattern instead of a dozen separate regions.

The same pattern with its supporting findings open

Learn tsmap · 03 Findings

An edge ring

For an edge ring, the item names the pattern, the bins that make up the loss and the test behind it. Together they tell you what kind of problem to look for.

What stands out for EDGE-LOT-01

Learn tsmap · 03 Findings

Buttons under an item

A pattern's item has small rounded buttons under it, and each names something behind it: the pattern, the bin and the test. 1 marks them. A bin's button carries its legend colour.

The buttons under the edge-ring item, outlined

Learn tsmap · 03 Findings

Show one at a time

Click a button to show only that test, bin or pattern on the map. It is the quickest way to see where one thing happens. This is Iddq, with the dies outside its limits marked ▽ and △.

The gallery showing Iddq after clicking its button

Learn tsmap · 03 Findings

A bin button

A bin's button shows only the dies in that bin. This is hard bin 3.

EDGE-LOT-01 after clicking the Hard bin 3 button

Learn tsmap · 03 Findings

One group, two bins

"Hard bin and soft bin 3 (same dies)" is one group of dies counted in both bin types. It is one problem, not two. A finding about the pass bin is folded into the yield finding for the same reason.

A finding that names hard bin 3 and soft bin 30 over the same dies

Learn tsmap · 03 Findings

A cluster at the centre

Failing dies that sit together form a cluster. Here a small group fails near the centre of every wafer, in a different place on each. The item names the pattern and the bins behind it. This is CLUST-LOT-03, in the repository's sample_data folder.

What stands out for CLUST-LOT-03

Learn tsmap · 03 Findings

A shift with no defect

Not every item is a pattern of failing dies. In PARAM-LOT-02 the top item is a test: Iddq is higher toward the edge on all twelve wafers, and many dies cross its high limit.

What stands out for PARAM-LOT-02

Learn tsmap · 03 Findings

The tables

Learn tsmap · 03 Findings

Wafer Yield

Wafer Yield draws one bar per wafer, in slot order, so a pattern that follows the slot order shows up. Use it to spot a wafer that sits apart from the rest: one far from the others is labelled a low or high outlier.

Wafer Yield in slot order

Learn tsmap · 03 Findings

Wafer Yield rows

A badge on a row counts that wafer's findings. Click a row to open the wafer. A single wafer has no such list.

Learn tsmap · 03 Findings

Sorted by yield

Yield re-sorts the wafers from lowest to highest, so the weakest come first. (The Sort: yield chart in lesson 05 goes the other way.) A row a point or more below the median is tinted, and darker as the gap grows.

Wafer Yield sorted by yield

Learn tsmap · 03 Findings

Which yield?

The panel's 66.2% mean per-wafer yield averages the 25 wafers' own yields, each wafer counting once. A pooled yield counts every die once, so big wafers weigh more. The label always says which. Check it before you compare the figure with one from somewhere else.

Learn tsmap · 03 Findings

Hard Bin Breakdown

Hard Bin Breakdown shows where the lost dies went. Bars are a share of dies: pass bins first, then failing bins from the most dies to the fewest.

Hard Bin Breakdown

Learn tsmap · 03 Findings

Soft bins

Soft switches the breakdown to soft bins, with their own colours. By default it follows the map's plot mode.

The breakdown in Soft

Learn tsmap · 03 Findings

Ring Yield

Ring Yield shows yield by ring from the centre out, each row with its difference from the wafer's yield. Ring is the default because edge roll-off dominates real wafer maps.

Ring Yield for the sample lot

Learn tsmap · 03 Findings

Quadrant

Quadrant splits the wafer into NE, NW, SE and SW instead of rings.

Quadrant Yield for the sample lot

Learn tsmap · 03 Findings

Test Values

The Test Values table has one row per test: the mean, Ppk (lesson 06 explains it) and the share of dies within limits. Ppk uses the overall spread, wafer-to-wafer variation included.

The Test Values table

Learn tsmap · 03 Findings

Functional Tests

The Functional Tests table gives pass and fail counts and the pass rate for each functional test.

The Functional Tests table

Learn tsmap · 03 Findings

Summary report

Summary report 1 opens a printable report: the findings, bins, regions and the full per-test table. It is the report Full report ▸ opens. Save it as a PDF from the print dialog.

The Summary report and Data tables buttons, outlined

Learn tsmap · 03 Findings

Data tables

Data tables 2 opens the same tables as the Data tab in Insights (lesson 06): statistics, every die, and one row per wafer, each with Copy and Export CSV. Insights does not need to be on.

The Data tables dialog

Learn tsmap · 03 Findings

Try it yourself

  1. In the web app, Load sample data
  2. Read the top item: which split yields most, and by how many points?
  3. Click the fmax_MHz row under Also: which split's wafers carry the most marked dies?
  4. Open Findings and click the edge-local spatial pattern: on how many wafers is it seen?
  5. In Wafer Yield, choose Yield: which wafer is lowest?
  6. Open Data tables and look at the Wafers table
Learn tsmap · 03 Findings

Check your results

  1. TT: its wafers yield 33.8 points more than the other wafers, mostly because fewer dies fail hard bin 2.
  2. The SS wafers, such as W04: SS is the slow corner, so many of its dies fall below the fmax_MHz low limit (▽). The TT wafers have only a few marked dies.
  3. 8 of 25 wafers: the finding says so, and the map marks its dies on each of them.
  4. W10 · FF is lowest, at 23.5% yield. W11 · SS is next, at 33.5%.
Learn tsmap · 03 Findings

Recap

  • What stands out ranks losses and signals, largest first. Most rows show their affected dies on the map; an item about groups of wafers shows a chart instead.
  • Findings lists what tsmap noticed by severity. Patterns carry the findings that support them.
  • The tables, Summary report and Data tables carry the numbers behind all of it

When you open a new lot, read the headline and the top item first, click a row to see where it is, then use the Findings list for the rest.

More in the wafer map guide

Learn tsmap · 03 Findings

Next lesson

04 · The lot view →

Stack a lot into one map, select the same dies on every wafer, name splits, and name and judge bins.

Learn tsmap · 03 Findings