Analyse your first wafer lot
For: anyone new to tsmap. No wafer files, no installation, and no prior knowledge of the app needed. Goal: load a real multi-wafer lot, find its worst wafer, and discover why it is the worst. You will need: a browser. Nothing else. Time: about 10 minutes.
At the end you will have found a genuine process-corner effect in a 25-wafer lot, and you will know which parts of the interface to reach for when you do it with your own data.
This is a guided walk-through with a known answer — follow it in order. For the full reference on any screen it touches, see the user guide. If you would rather learn from slides, one idea at a time, try Learn tsmap.
1. Open tsmap
Go to wafertools.github.io/tsmap/app/.
The browser version needs no download and parses files entirely on your own machine — nothing is uploaded. Everything below works identically in the desktop app if you have it installed.
You should see an empty toolbar with Open files, Add files, and — in the middle of the window — Load sample data.
2. Load the sample lot
Click Load sample data.
This loads PVT-LOT-05, a synthetic 25-wafer lot generated for demonstration — no real device
data. It is a process-corner lot: each wafer was run at a deliberately different corner of
the process window, and tsmap labels each one automatically.
3. Import the tests
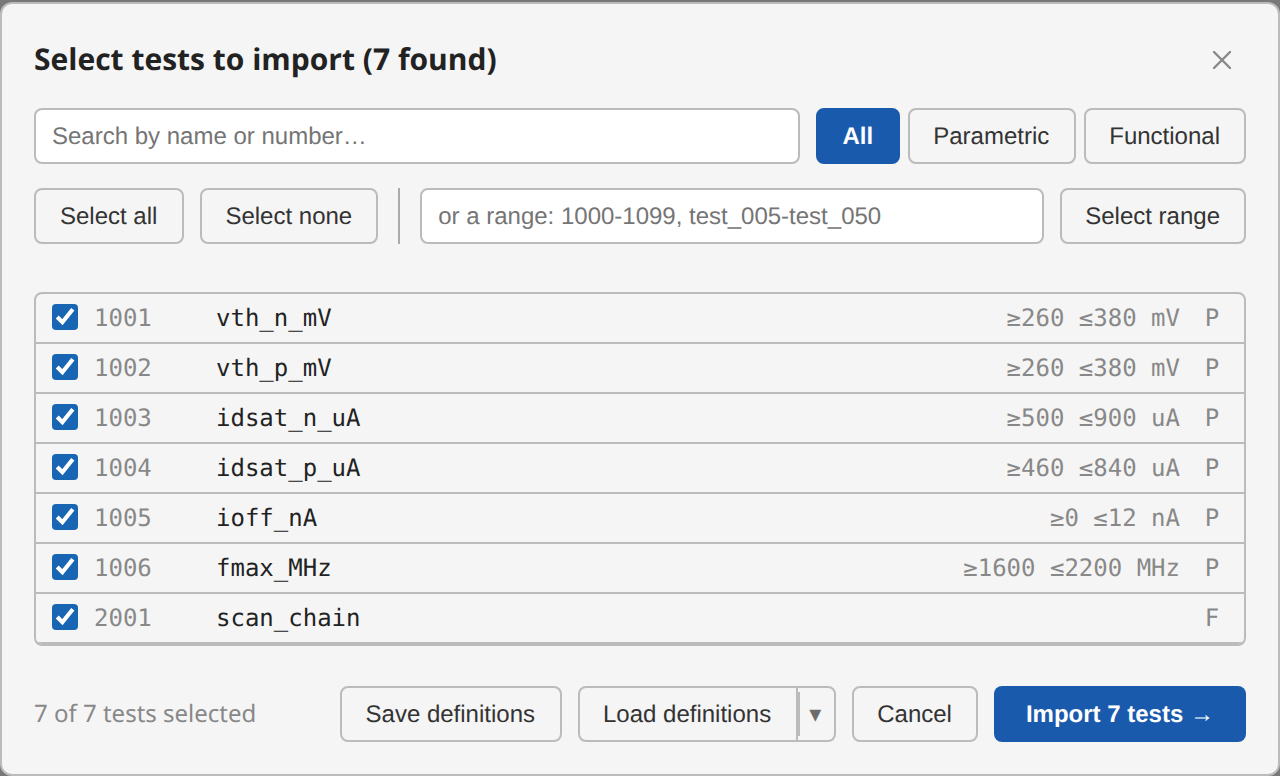
The sample lot has 14 tests (six parametric, eight functional). A small lot like this imports every test straight away, and the log reports "14 tests imported". A large lot instead opens a test selector before parsing, starting empty, so that "import everything" can never be the accidental default. See Memory advisory for where that line falls.
To choose tests after the load, open Setup ▾ → Tests…:
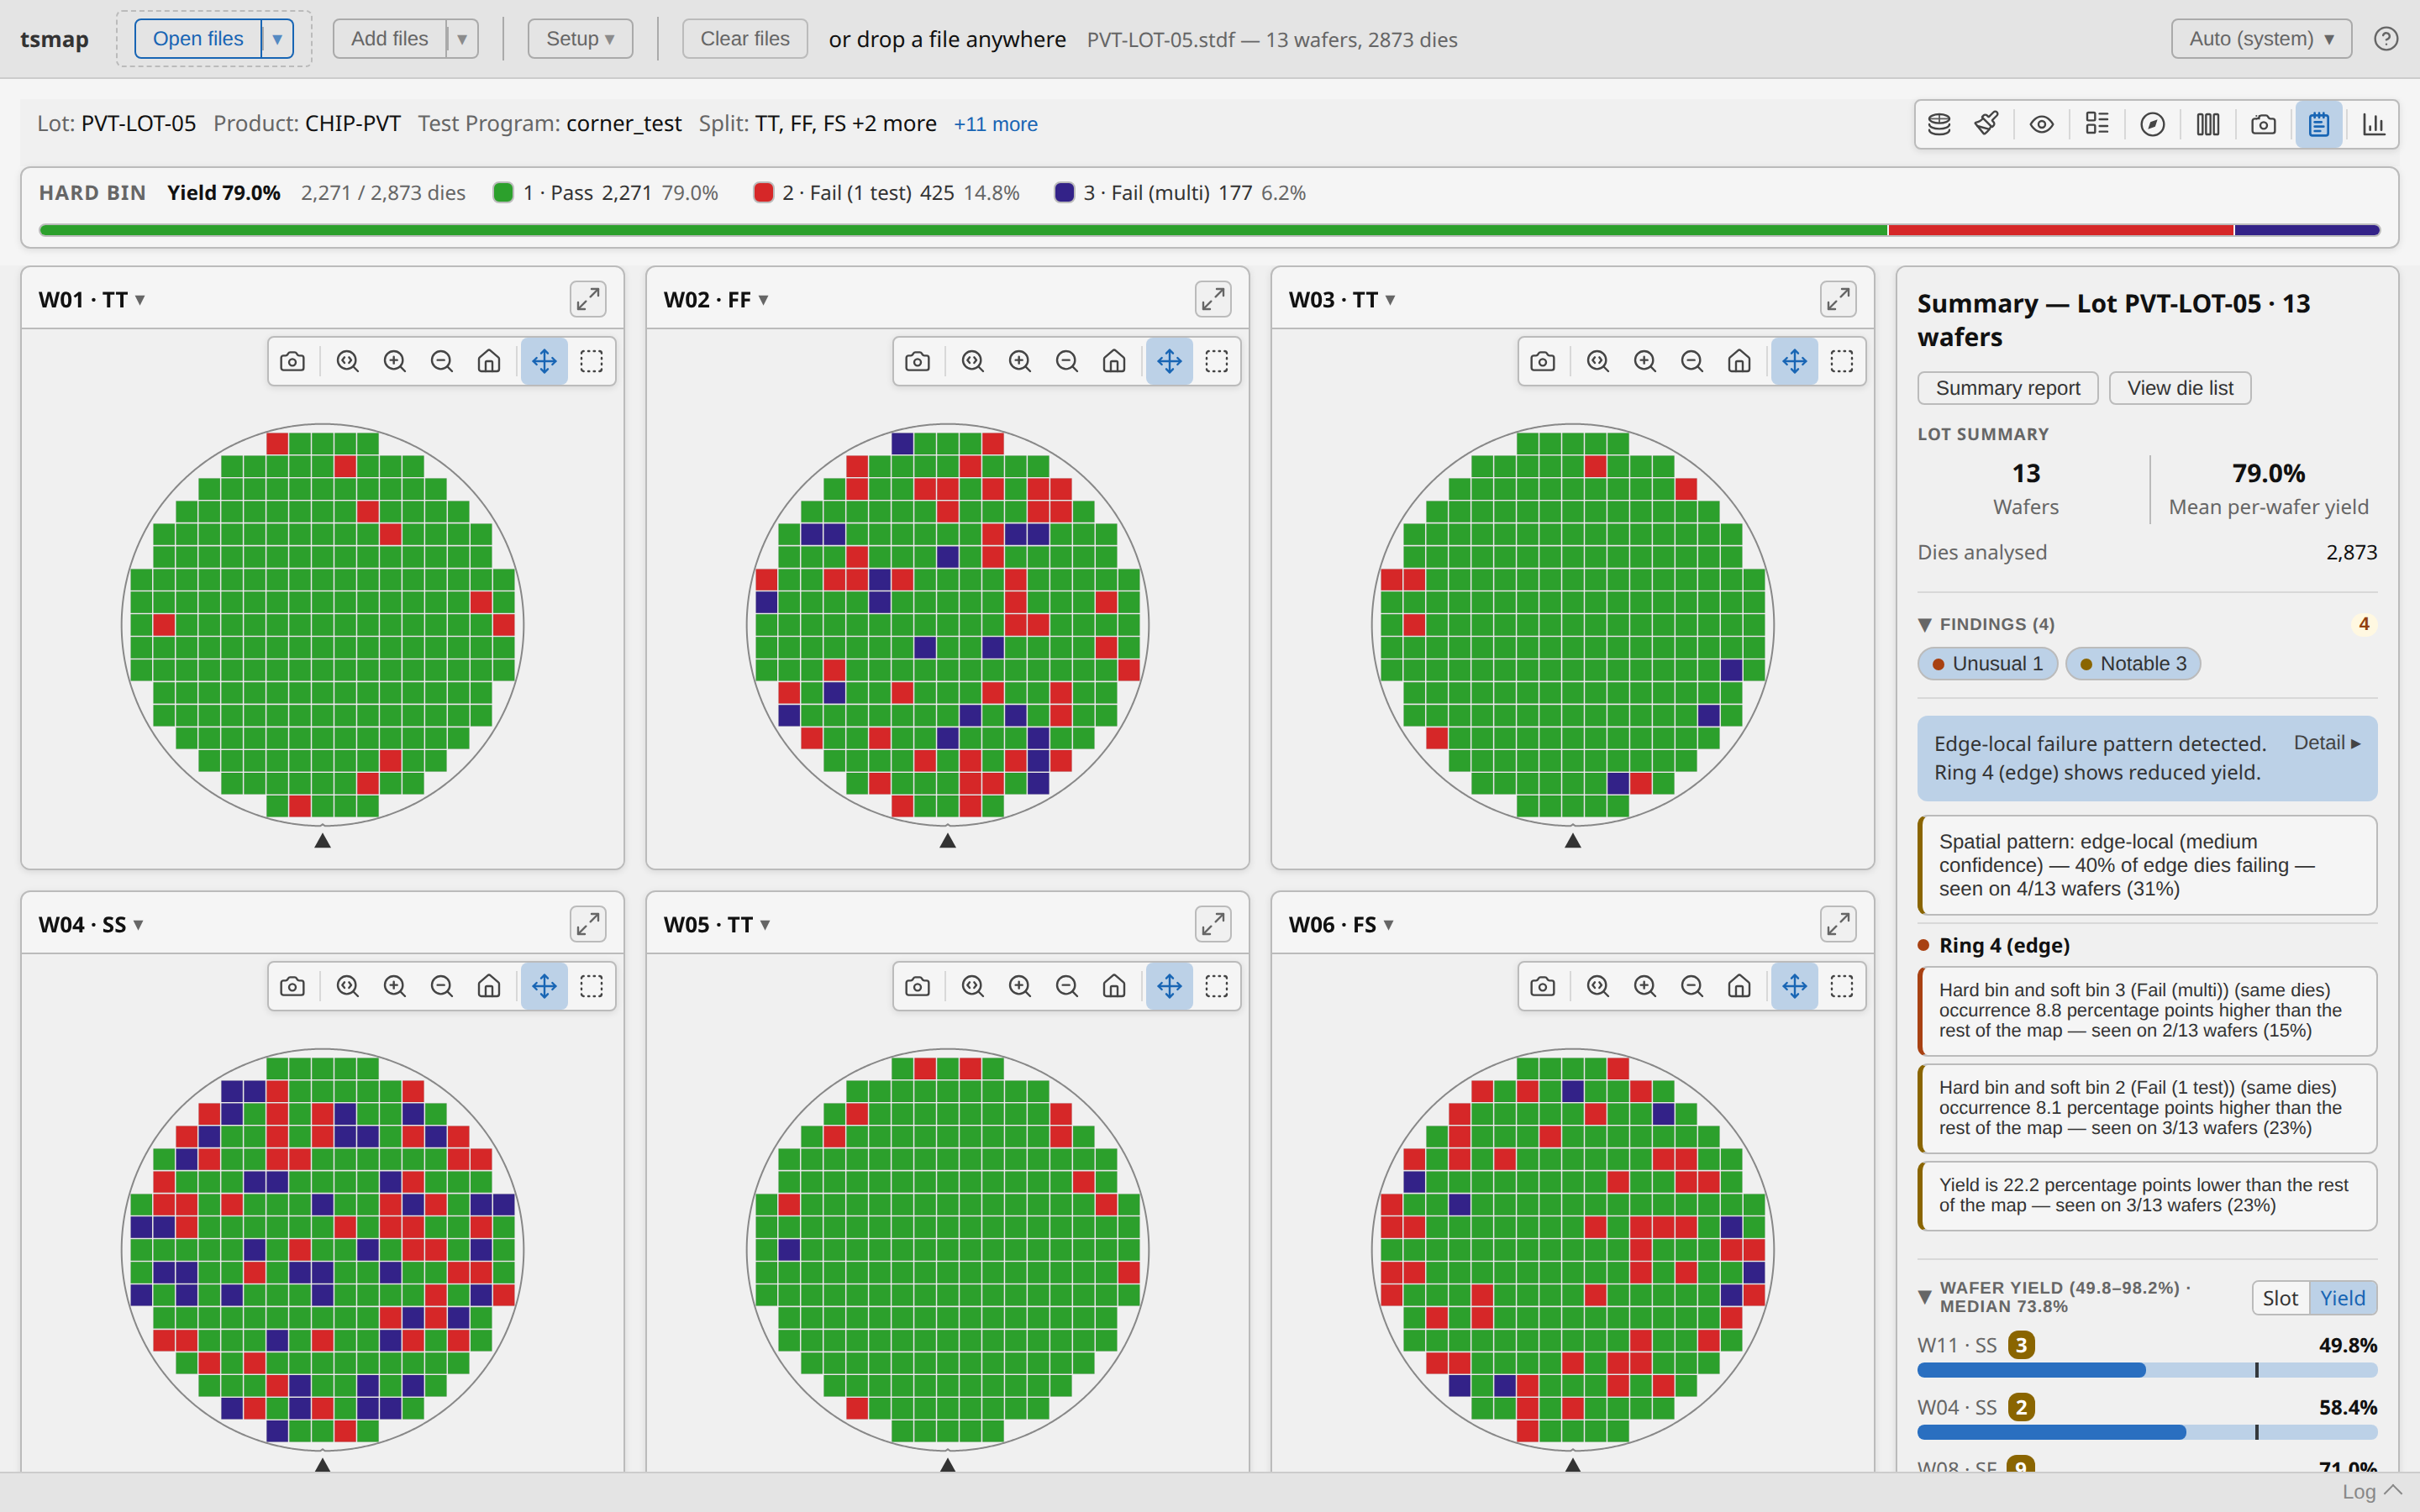
You should now see a grid of 25 wafer maps, each card titled like W01 · TT, with a
Summary panel down the right-hand side, headed Lot PVT-LOT-05 · 25 wafers — every wafer
comes from that one lot, so the panel names it. The · TT suffix is the process corner —
those were applied automatically along with the sample.
4. Read the lot summary
Before looking at any single wafer, read the panel on the right. It reports:
- 25 wafers, 66.2 % mean per-wafer yield, 5,525 dies analysed.
- A Findings section — 6 findings, 4 Unusual and 2 Notable.
Among them: "Spatial pattern: edge-local — seen on 8/25 wafers", and a weak test site (site 3). tsmap found those on its own: nothing was configured to look for them.
Mean per-wafer yield is not lot yield. It is the arithmetic mean of 25 per-wafer percentages, so every wafer counts equally regardless of how many dies it has. The label says which one it is — worth reading carefully whenever you quote a number from here.
5. Find the worst wafer
Scroll to Wafer Yield at the bottom of the panel. It lists every wafer in slot order by default. Click Yield on the small Slot | Yield toggle to re-sort worst-first.
The order is now:
| Wafer | Yield |
|---|---|
| W10 · FF | 23.5 % |
| W11 · SS | 33.5 % |
| W18 · SS | 38.9 % |
| W08 · SF | 40.3 % |
| … | … |
| W03 · TT | 91.0 % |
| W01 · TT | 91.4 % |
This is the moment the lot explains itself. The worst wafers are all skew corners (FF, SS, SF). The best are all TT. Yield is tracking the process corner, not the slot number — and slot order, the default view, hides that completely.
6. Look at the worst wafer
Click the ⤢ expand icon on the W10 · FF card to open it on its own.
Use the Plot mode button in the toolbar to switch between Hard Bin and Soft Bin. Hard bin tells you whether a die failed; soft bin tells you how — the same failures, resolved into finer categories. Hover any die for its coordinates, bin, and test values.
Close the expanded view when you are done.
7. Compare the corners
Click Insights (the switch at the far right of the toolbar row, beside Maps). You get five tabs: Overview, Distributions, Correlation, Data and My plots.
On Overview, find the Group by: picker and choose Split.
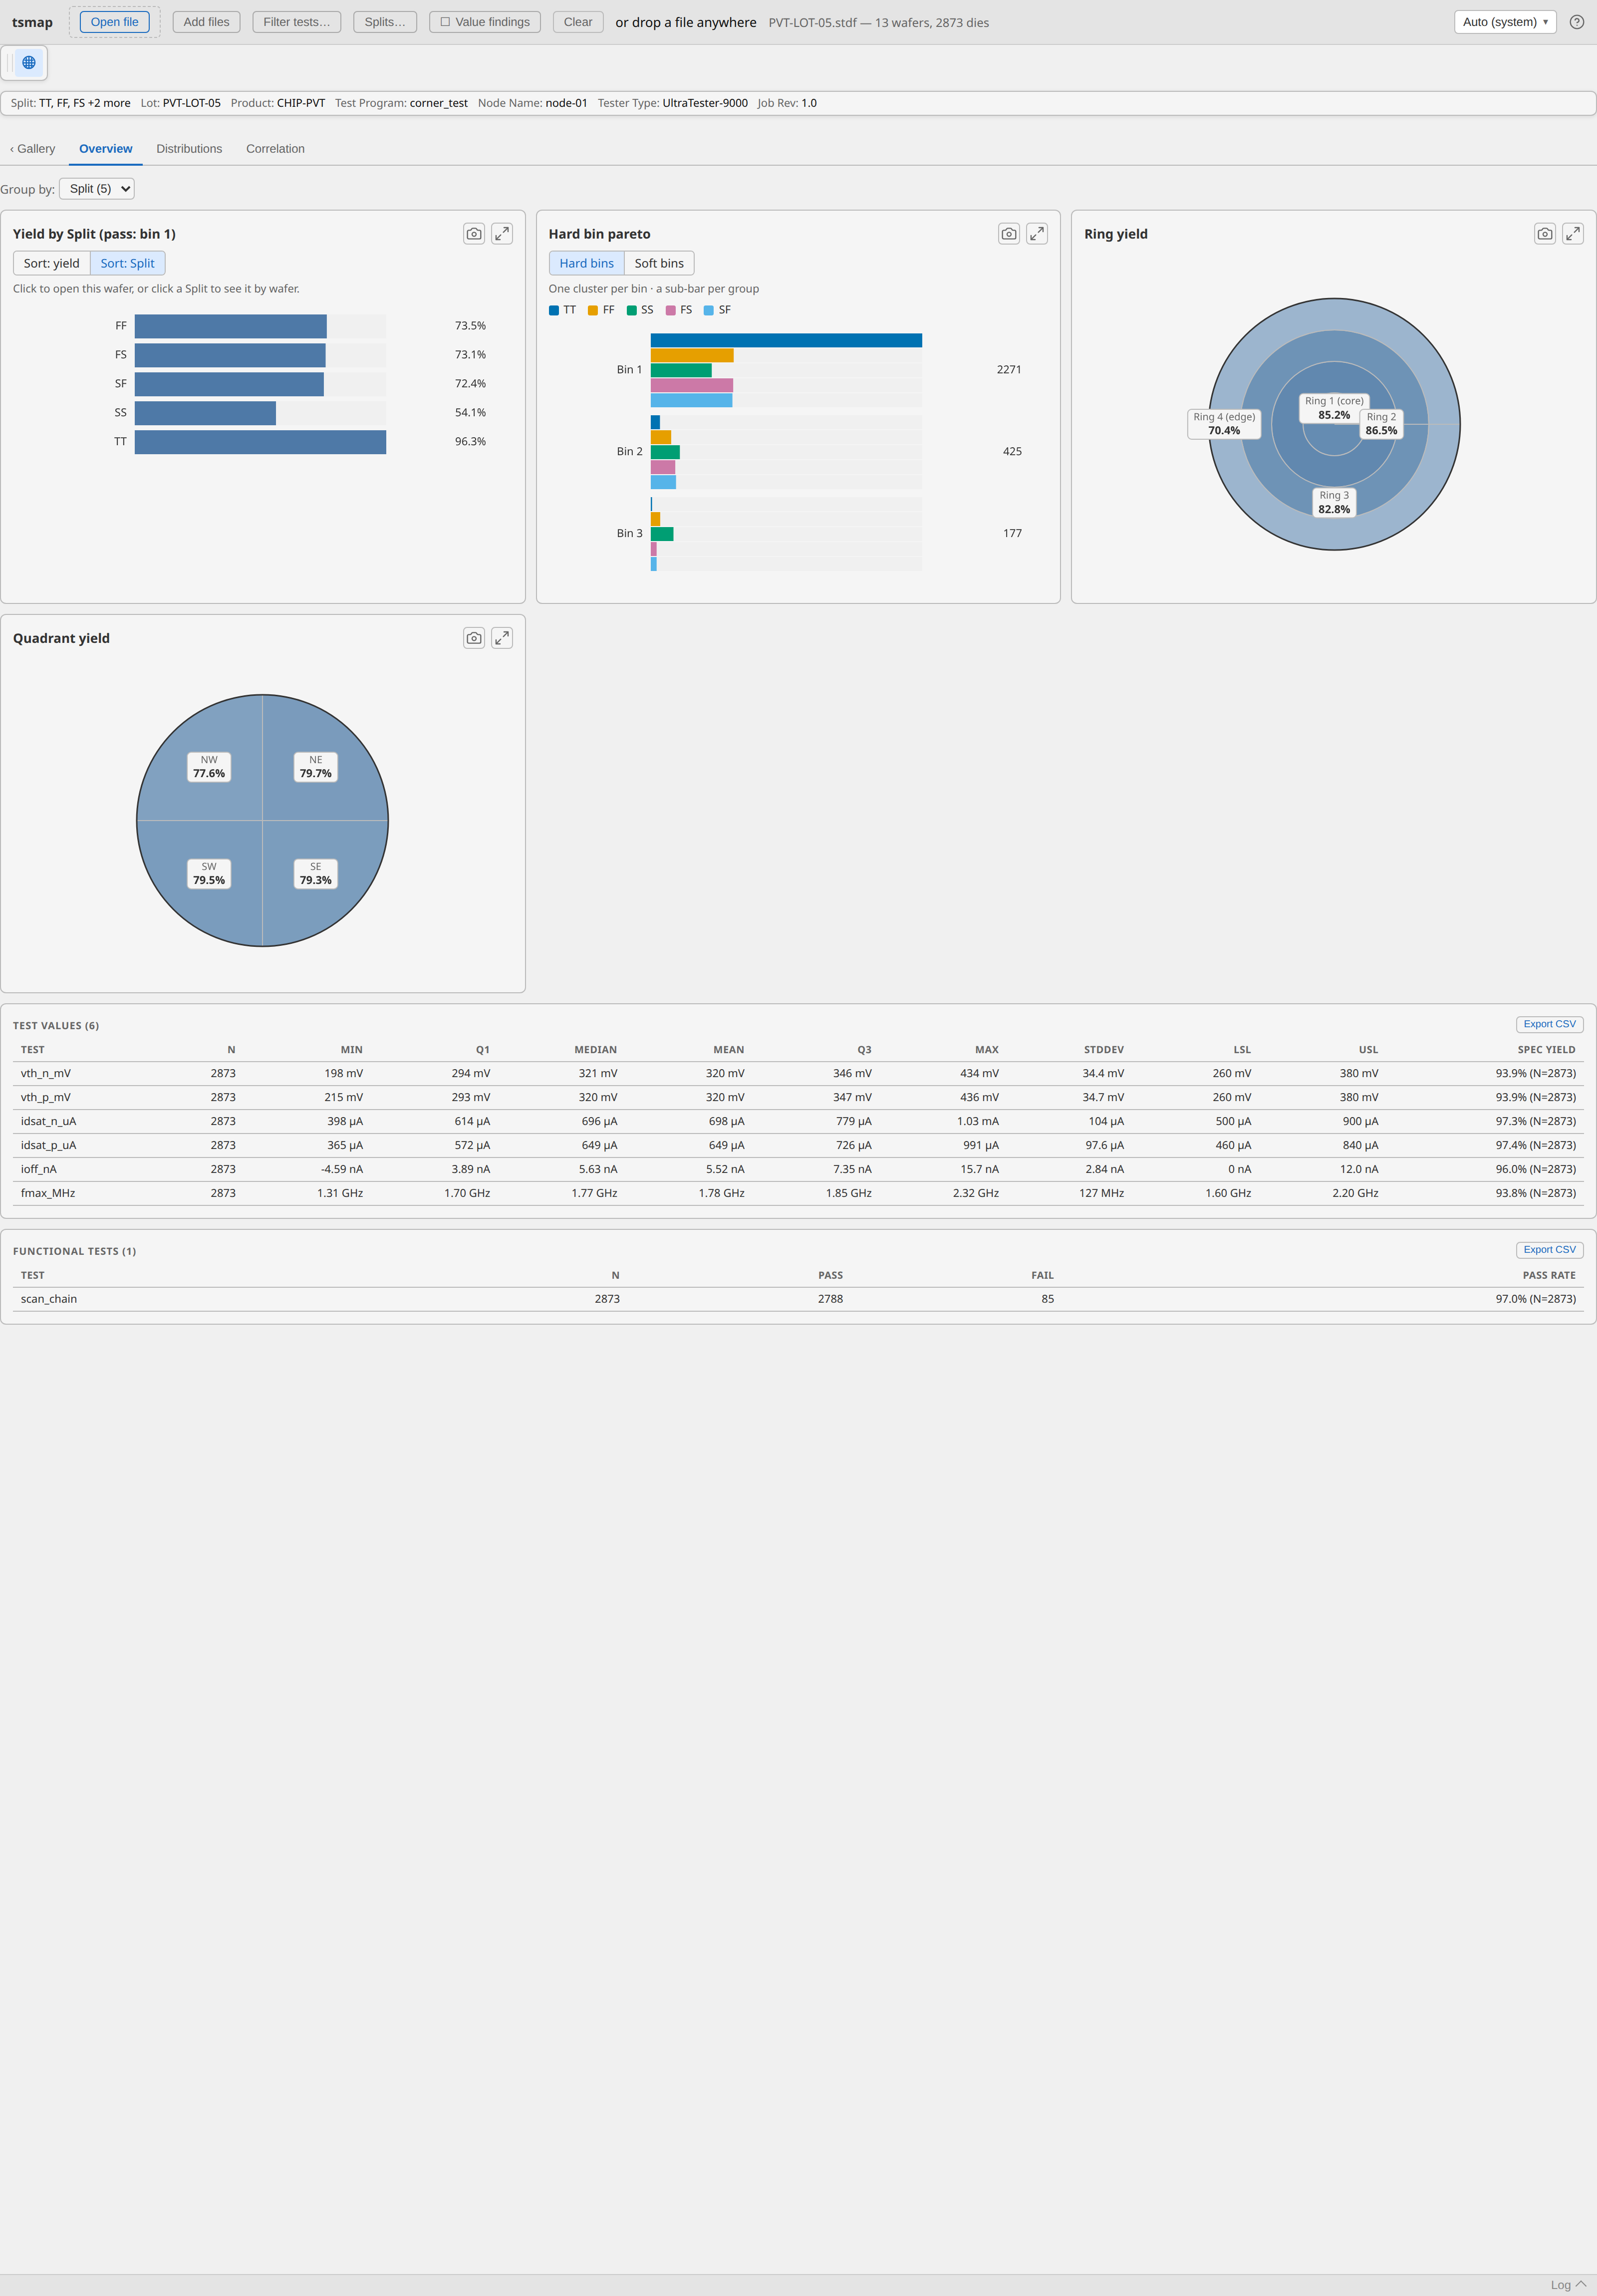
Every panel now reports per corner instead of per wafer. Yield by Split ranks the corners directly, and the bin pareto shows which bins each corner is losing dies to — SS failing differently from FF is a different problem from SS simply failing more.
Click a bar in Yield by Split to drill into that corner's individual wafers, then ← Back to return.
8. Export one result
Any of these work from the lot view:
- Summary report (top of the Summary panel) — a self-contained HTML report of the whole lot.
- Data tables (beside the report button) — the underlying numbers as tables of statistics, dies and wafers, each with Export CSV and Copy.
- Download gallery PNG (camera icon in the toolbar) — the wafer grid as an image.
What you have done
- Loaded a 25-wafer lot and imported its tests.
- Read a lot-level summary and let tsmap surface an edge-related pattern unprompted.
- Re-sorted by yield and found that the worst wafers sit in the skew process corners.
- Switched between hard and soft bin to separate whether from how.
- Grouped the whole analysis by split to compare corners rather than wafers.
- Exported a result.
Where to go next
- Your own data — Supported file formats and, for CSV/JSON/Parquet, Column mapping.
- Splits on your own lots — the sample's corners were pre-assigned; assign your own in Wafer splits.
- Other things to try — the repository's
sample_data/folder has lots for retests, a multi-project wafer, validity limits and more; the sample files table says what each shows. - Something not working — Troubleshooting.
- The rest of the interface — the user guide.