 tsmap · learn
Learn tsmap
Short lessons, one idea per slide, each ending with a lab in the web app. New to tsmap? Start with 00. Use the arrow keys to move through a lesson.
The core path: 00 to 06
What most people need: getting data in, reading maps and findings, and the Insights charts.
- 00 Welcome to tsmapWhat a wafer map shows, what tsmap is and where it runs, and a tour of the screen.
- 01 Getting data inSample data, file formats, opening, adding and scanning files, the test selector, column mapping, the colour theme and the log.
- 02 Reading a map and the toolbarPlot modes, colour schemes, overlays, orientation, the gallery layout, and one wafer close up.
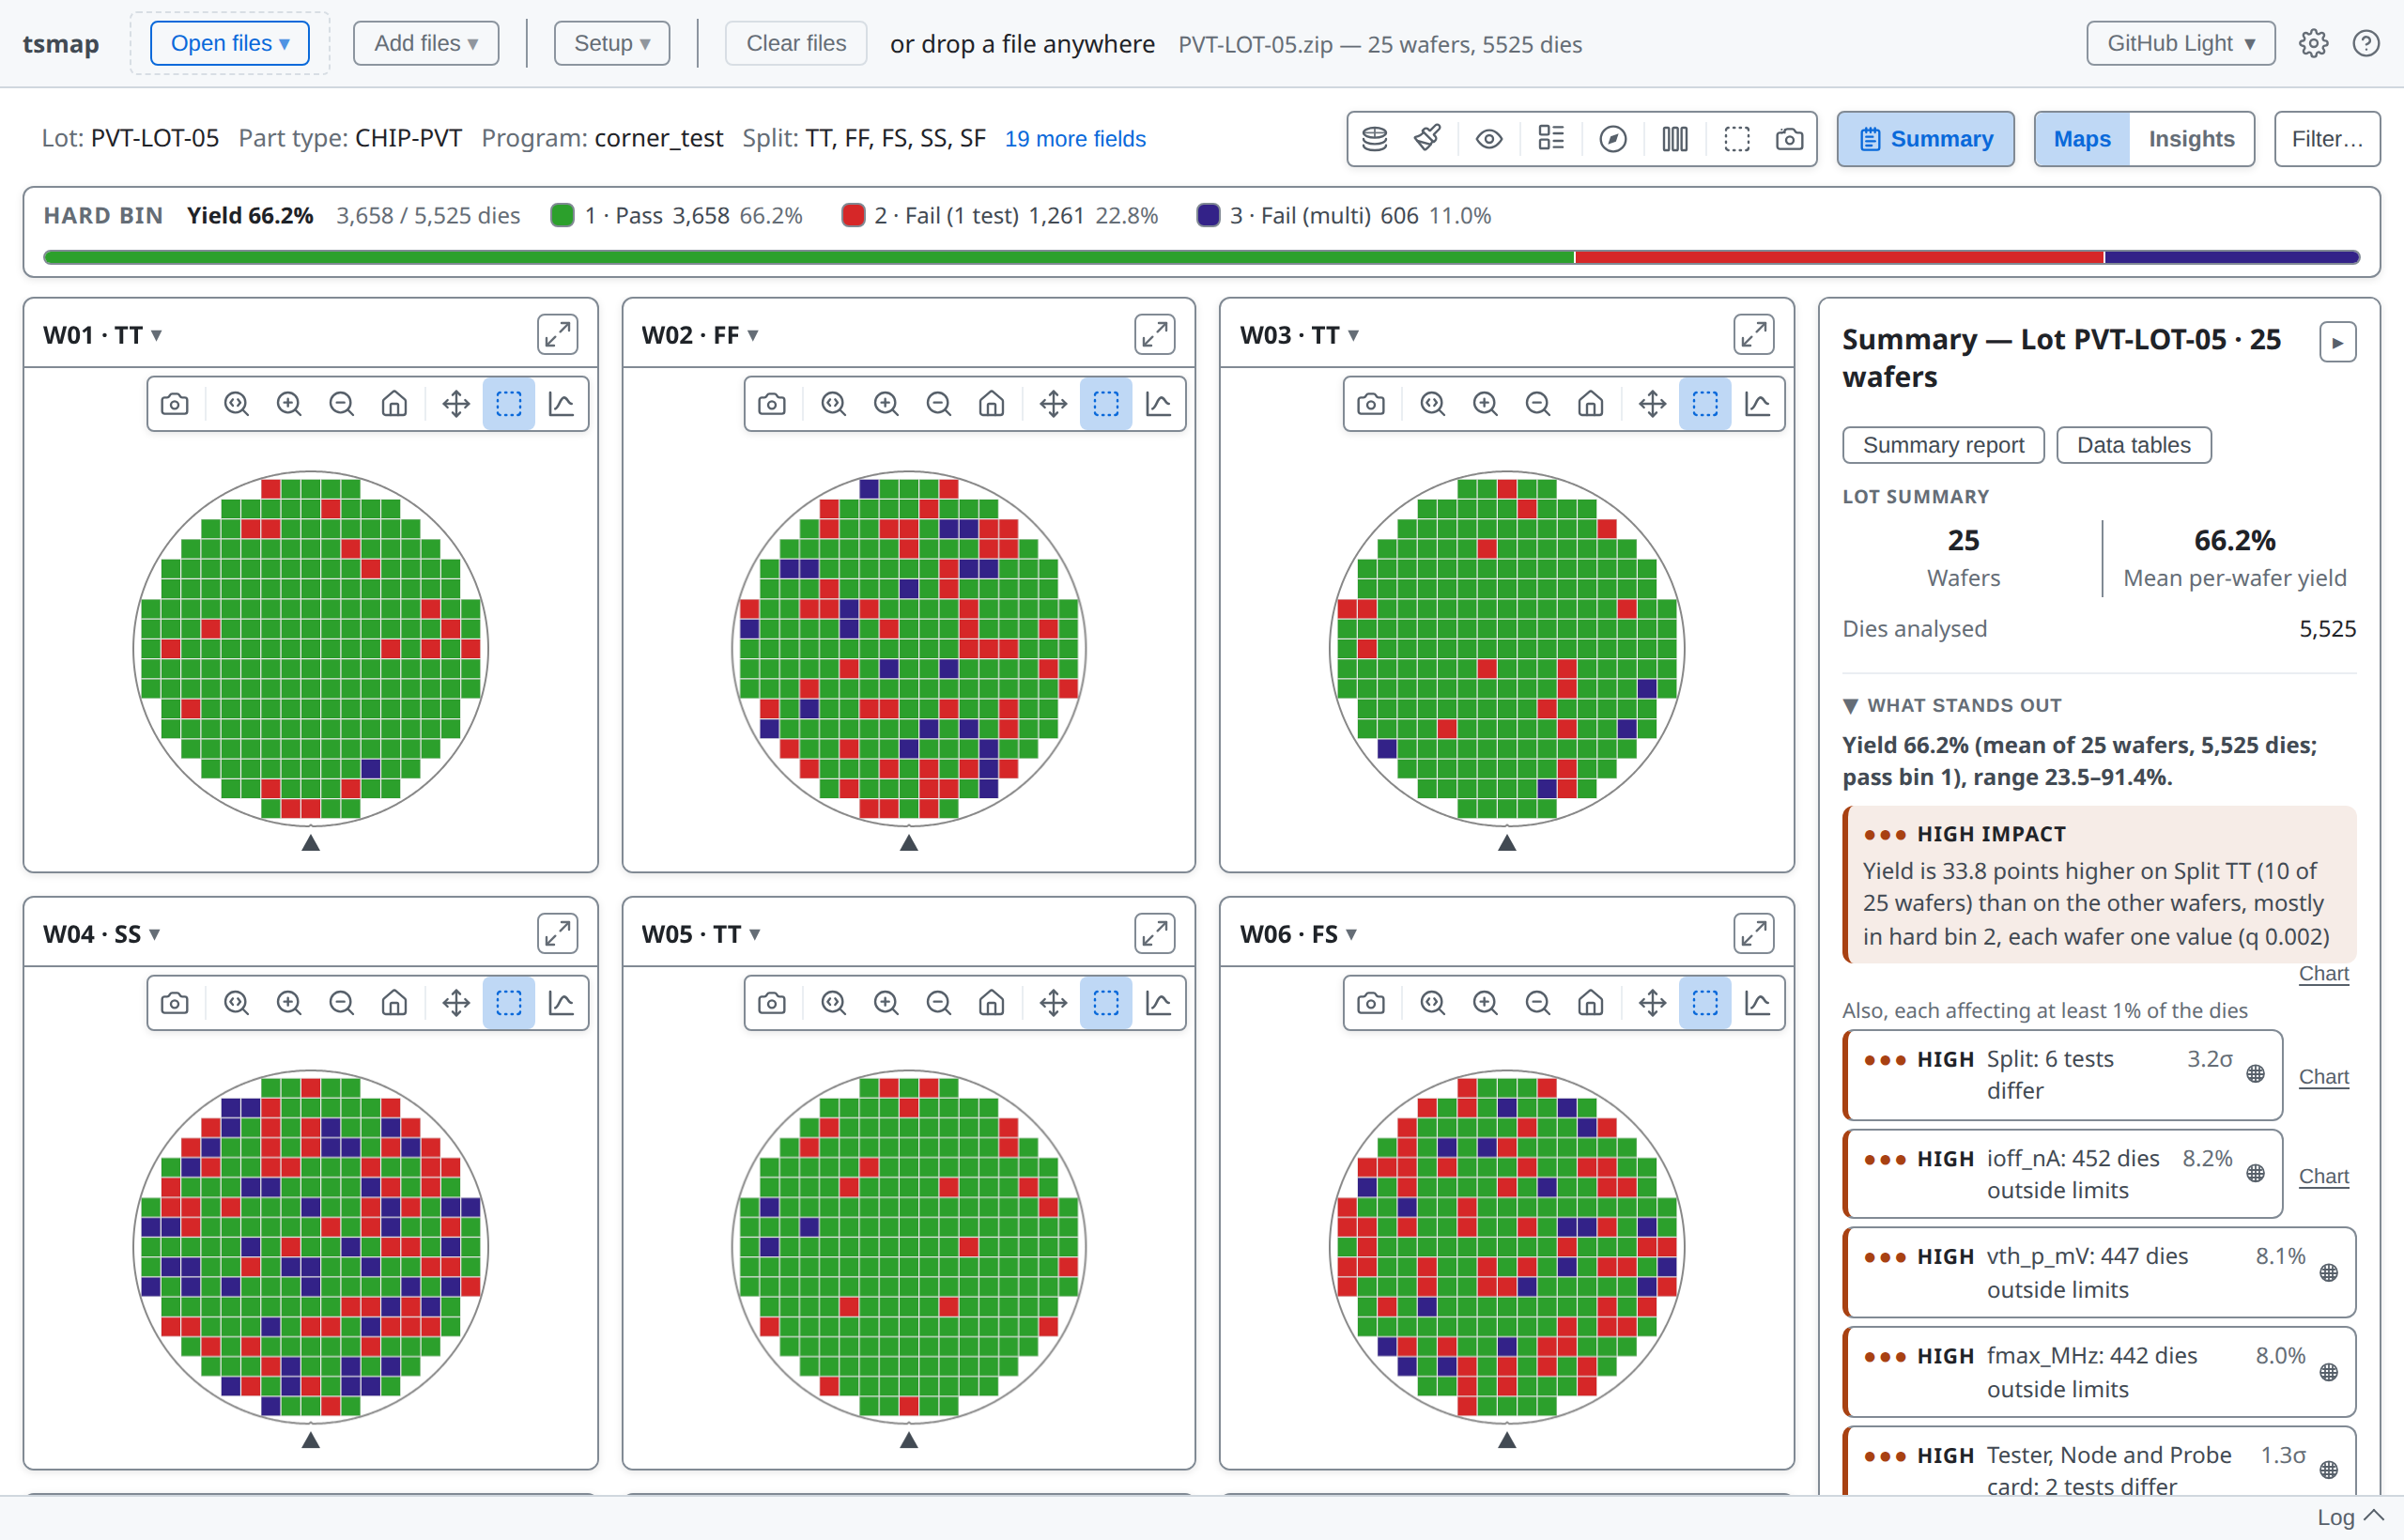
- 03 FindingsWhat stands out, the findings list, and the Summary panel's tables, read on the sample lot.
- 04 The lot viewStack a lot into one map, select the same dies on every wafer, and name wafer splits, and name and judge bins.
- 05 Insights: where yield is lostYield by wafer, bins, pass rates, part average testing, what divides yield, and Group by.
- 06 Insights: distributions and dataDistributions and capability, comparing groups of wafers, the wafer-to-wafer trend and the data tables behind every chart.
When you need them: 07 onwards
Pick the lesson that matches the job in hand.
- 07 CorrelationFind tests that move together, and check the relationship holds inside each group.
- 08 Drilling into any populationFilter wafers and dies, then chart and tabulate any selection, bin, wafer or finding.
- 09 Derived testsCompute new tests from measured ones: write them in the Derived tests editor or a definitions file, and use them like any other test.
- 10 Your own plots and sweepsThe plot editor: build charts, keep them, reuse them on the next lot, and read a run of tests as a sweep curve.
- 11 Unusual wafersMulti-project wafers, wafers with no positions, retests, multi-site testing, reticles, wafer geometry and clamped values.
- 12 Automation and integrationOpen data from a link or the command line, and manage definitions files and saved settings.