Developer Guide — Bins, test values and metadata¶
Part of the Developer Guide.
Working with bins¶
Bins are the primary pass/fail classification from wafer test equipment. Hard bins are the physical sort result; soft bins are the failure category assigned by the test program.
Basic bin map¶
const results = rows.map(r => ({
  x:    Number(r.x),
  y:    Number(r.y),
  hbin: Number(r.hbin),
}));

const result = buildWaferMap({ results });
renderWaferMap(container, result);
// Opens in 'hardBin' mode by default
Named bins with custom colours¶
Without names, bins are labelled "HBin 1", "HBin 2", etc. Supply hbinDefs for
readable labels and optional colour overrides:
const result = buildWaferMap({
  results,
  hbinDefs: [
    { bin: 1, name: 'Pass',          color: '#2ecc71' },
    { bin: 2, name: 'Contact Open',  color: '#e74c3c' },
    { bin: 3, name: 'Vth - Hi NMOS', color: '#e67e22' },
    { bin: 5, name: 'Continuity',    color: '#9b59b6' },
  ],
});

renderWaferMap(container, result, {
  viewOptions: { plotMode: 'hardBin' },
});
Tip: Pass
hbinDefsintobuildWaferMap, not justrenderWaferMap. The stats engine and tooltips both read them from the built result.
Hard bin and soft bin together¶
const results = rows.map(r => ({
  x:    Number(r.x),
  y:    Number(r.y),
  hbin: Number(r.hbin),
  sbin: Number(r.sbin),
}));

const result = buildWaferMap({
  results,
  hbinDefs: [ { bin: 1, name: 'Pass' }, /* ... */ ],
  sbinDefs: [ { bin: 10, name: 'Vth - Lo' }, { bin: 11, name: 'Vth - Hi' }, /* ... */ ],
});

renderWaferMap(container, result);
// hbinDefs and sbinDefs are inherited automatically from the result
// User can switch between Hard Bin and Soft Bin in the toolbar Mode menu
Pass bins and yield¶
The library counts yield against passBins (default [1]). Change this if your
pass bin isn't 1:
const result = buildWaferMap({
  results,
  passBins: [1, 100],   // bins 1 and 100 are both counted as pass
});

const yld = result.yield.yieldPercent;
console.log(yld !== null ? `${yld.toFixed(1)}%` : 'n/a');
Set pass bins once, here. The result carries them (result.passBins), and every
renderer, analysis, panel, report and chart reads them from it — so bin 100 above is green,
listed with the passing bins and counted as good everywhere, with nothing to repeat. In a
gallery each wafer keeps its own, so a lot mixing test programs is judged wafer by wafer. There is no
passBins option on the renderers or on analyzeWaferMap; a map you build yourself, without
buildWaferMap, states its own passBins on the map object.
How bin colours are assigned¶
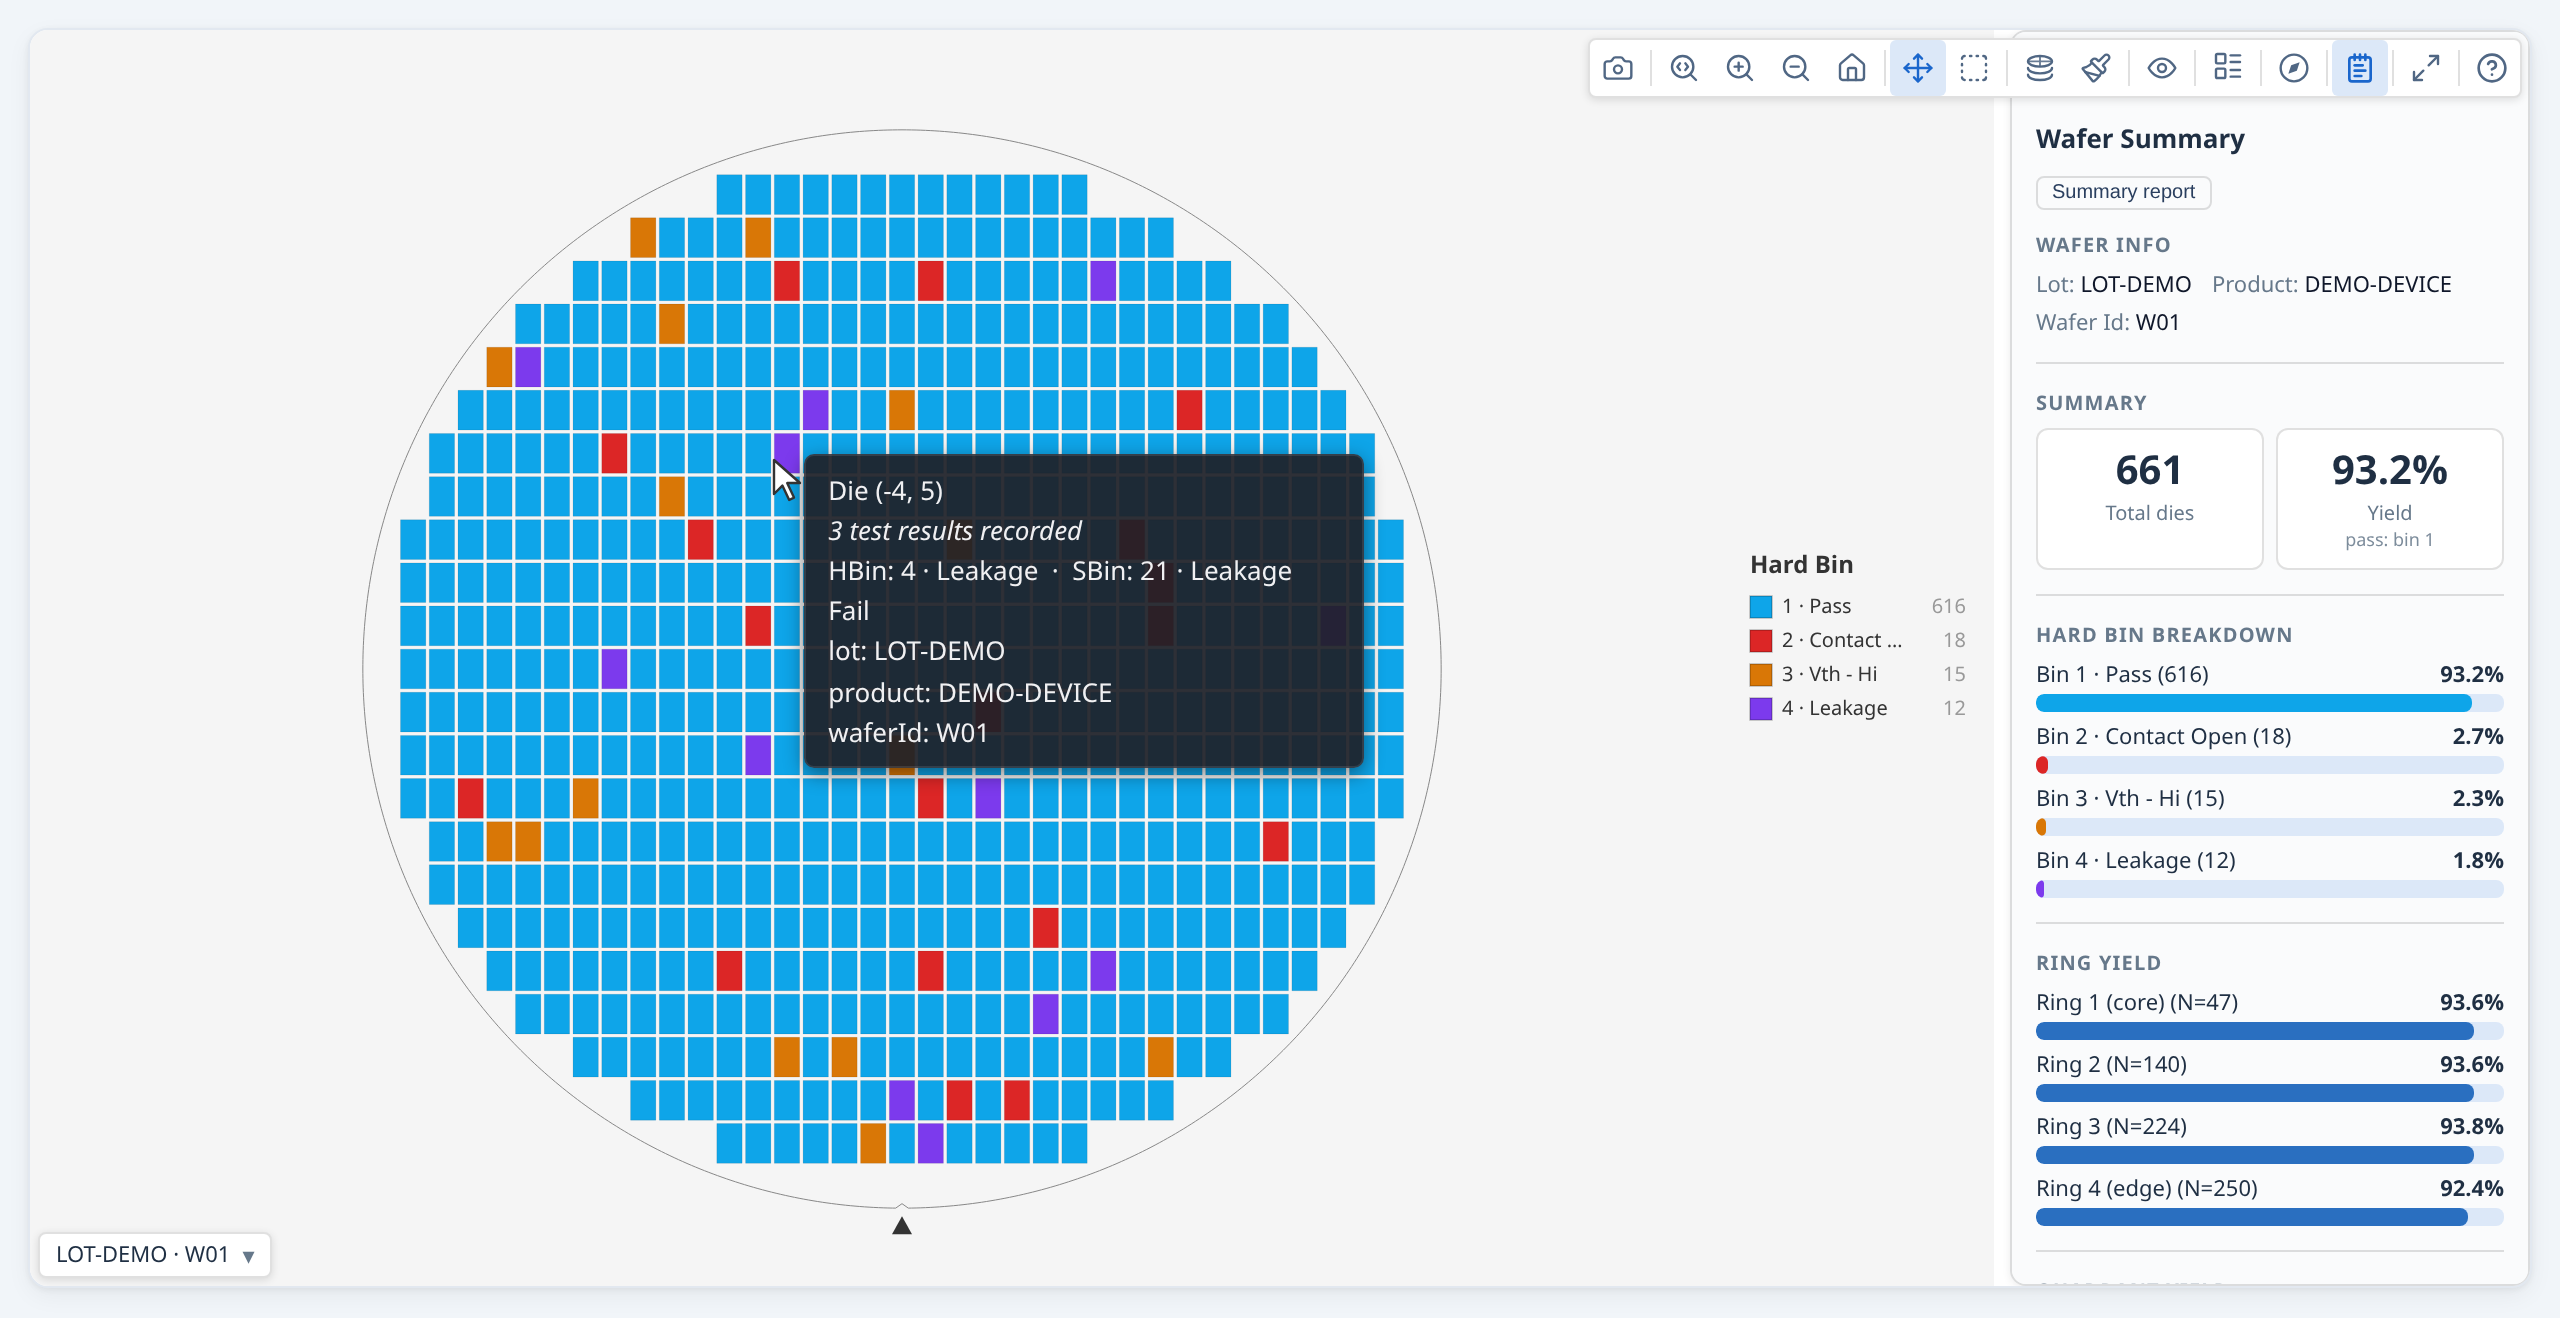
A bin's colour comes from its number and whether it passes, never from how many dies it has, so bin 7 is the same colour in every lot, gallery and screenshot of a program. One rule (which every surface uses — map, legend, summary panel, Insights charts) applies it:
- Pass bins are green, fail bins are not. Which bins pass comes from
passBins, so a failing bin 1 is never green and a passing bin 3 always is. A soft bin counts as passing when every die carrying it passes. - The bin number picks the colour. Bin 1 takes the palette's first pass colour and bin 2 its first fail colour, then on through each list, wrapping round. The front of each list is the most distinct, so the low bin numbers most programs use get the clearest colours.
- Hard and soft bins are coloured separately. Soft bins start half a palette further on, so hard bin 3 and soft bin 3 are different colours.
- Bins a palette-length apart share a colour (fail bins 2 and 21 in the default palette).
When both are on screen the map raises a
bin-colors-sharedwarning naming them rather than letting two bins look identical. - Colours from bin definitions win. A
BinDef.color(a site's standard bin colour sheet, say) overrides the palette for that bin; the viewer can switch that off with Use colours from bin definitions in the Palette menu, and back on again.
Using bin colours in your own UI¶
When your application shows bins next to the map — a table with colour swatches, an exported chart, a slide — use the colours the map draws rather than picking your own:
const colors = ctrl.getBinColors();   // a live map or gallery, with the palette the user chose
colors.hard.get(7);                   // hard bin 7's colour
colors.pass.hard.has(2);              // whether hard bin 2 passes on this map

import { binColorsForMaps } from '@wafertools/wafermap';
const exportColors = binColorsForMaps(results, { binColorScheme: 'accessible' });  // no map on screen
binColorsForMaps judges each map by its own passBins, so bins keep the colours they have on
screen, even in a lot that mixes test programs. Hard and soft bins are separate Maps.
Working with test values¶
Three related terms appear together throughout the API — here is how they fit:
| Term | Where it appears | Purpose |
|---|---|---|
testValues: { 1010: 0.95 } |
DieResult (input to buildWaferMap) |
Per-die measurement; key is the integer test number |
testDefs: [{ testNumber: 1010, name: 'Vth', unit: 'V' }] |
buildWaferMap options |
Connects test numbers to human-readable names and units; optional but recommended |
testNumbers: [1010, 1020] |
analyzeWaferMap options |
Filter — limits which tests the stats engine analyses; required only when the data has more tests than you want to analyse |
The integer key in testValues and testDef.testNumber must match exactly — the library uses these to link measurements to names and to drive the stats engine.
Continuous test measurements (leakage current, threshold voltage, etc.) go in
testValues — a map keyed by a stable integer test identity. TestDef is
optional: without it the library uses Test {N} (the testNumber) everywhere a
name would appear — mode dropdown, tooltip, colorbar axis, summary panel. Add
TestDef when you want human-readable names, units, and SI prefix formatting:
const results = rows.map(r => ({
  x:          Number(r.x),
  y:          Number(r.y),
  testValues: {
    1050: Number(r.idsat),
    1060: Number(r.vth),
    1070: Number(r.ioff),
  },
}));

const result = buildWaferMap({
  results,
  dieConfig: { width: 8, height: 12 },
  testDefs: [
    { testNumber: 1050, name: 'Idsat', unit: 'A' },
    { testNumber: 1060, name: 'Vth',   unit: 'V' },
    { testNumber: 1070, name: 'Ioff',  unit: 'A' },
  ],
});

renderWaferMap(container, result, {
  viewOptions: {
    plotMode:   'value',
    activeTest: 1050,   // testNumber for Idsat — NOT a positional index
    // testDefs inherited automatically from the result
  },
});
The testValues key is any stable integer that uniquely identifies the test — for
example an STDF TEST_NUM, a database test ID, or an application-defined constant.
The key must match the testNumber field in the corresponding TestDef.
Always pass the SI base unit in TestDef.unit (e.g. 'A', 'V', 'Ω', 'F').
The formatter applies SI prefixes automatically — 0.03 with unit 'Ω' displays as
30 mΩ. Passing a pre-scaled unit like 'mA' would produce incorrect labels
(e.g. 30 µmA instead of 30 nA).
With testDefs in place:
- The toolbar Mode dropdown shows one entry per test by name ("Idsat", "Vth", …) — without testDefs it shows "Test 1050", "Test 1060", etc.
- Hover tooltips show "Idsat: 1.23 mA" — without testDefs they show "Test 1050: 1.23 mA"
- The colorbar axis label includes the name and unit — without testDefs it shows "Test 1050"
- The summary panel Test Values section uses test names — without testDefs it uses "Test 1050", etc.
TestDef.logScale: true enables log₁₀ scale for that test by default (silently falls back to linear when any die value ≤ 0). The user can also toggle log scale at any time via the toolbar Log scale button, which overrides the per-test default.
Spec limits on test parameters¶
Add limitLow and/or limitHigh to a TestDef to specify the engineering specification window. Both are optional independently — one-sided limits are valid. Once limits are defined, two things happen automatically across all plot modes:
In value mode — test limits affect both the colorbar and the die colours:
The colorbar always shows "Lo limit" / "Hi limit" labels at the limit positions. Exactly how depends on the colorbar range mode (toggled via the bracket toolbar button):
colorbarRangeMode controls only the colorbar's numeric range — not how dies outside the limits are shown:
colorbarRangeMode: 'spec'(default when limits are present) — the bar spans[limitLow, limitHigh]. The limit values appear as "Lo limit" / "Hi limit" labels at the bar endpoints alongside the numeric values.colorbarRangeMode: 'data'— the bar spans the actual data min/max. The limits are shown as marker lines on the bar wherever the limits fall within the data range.
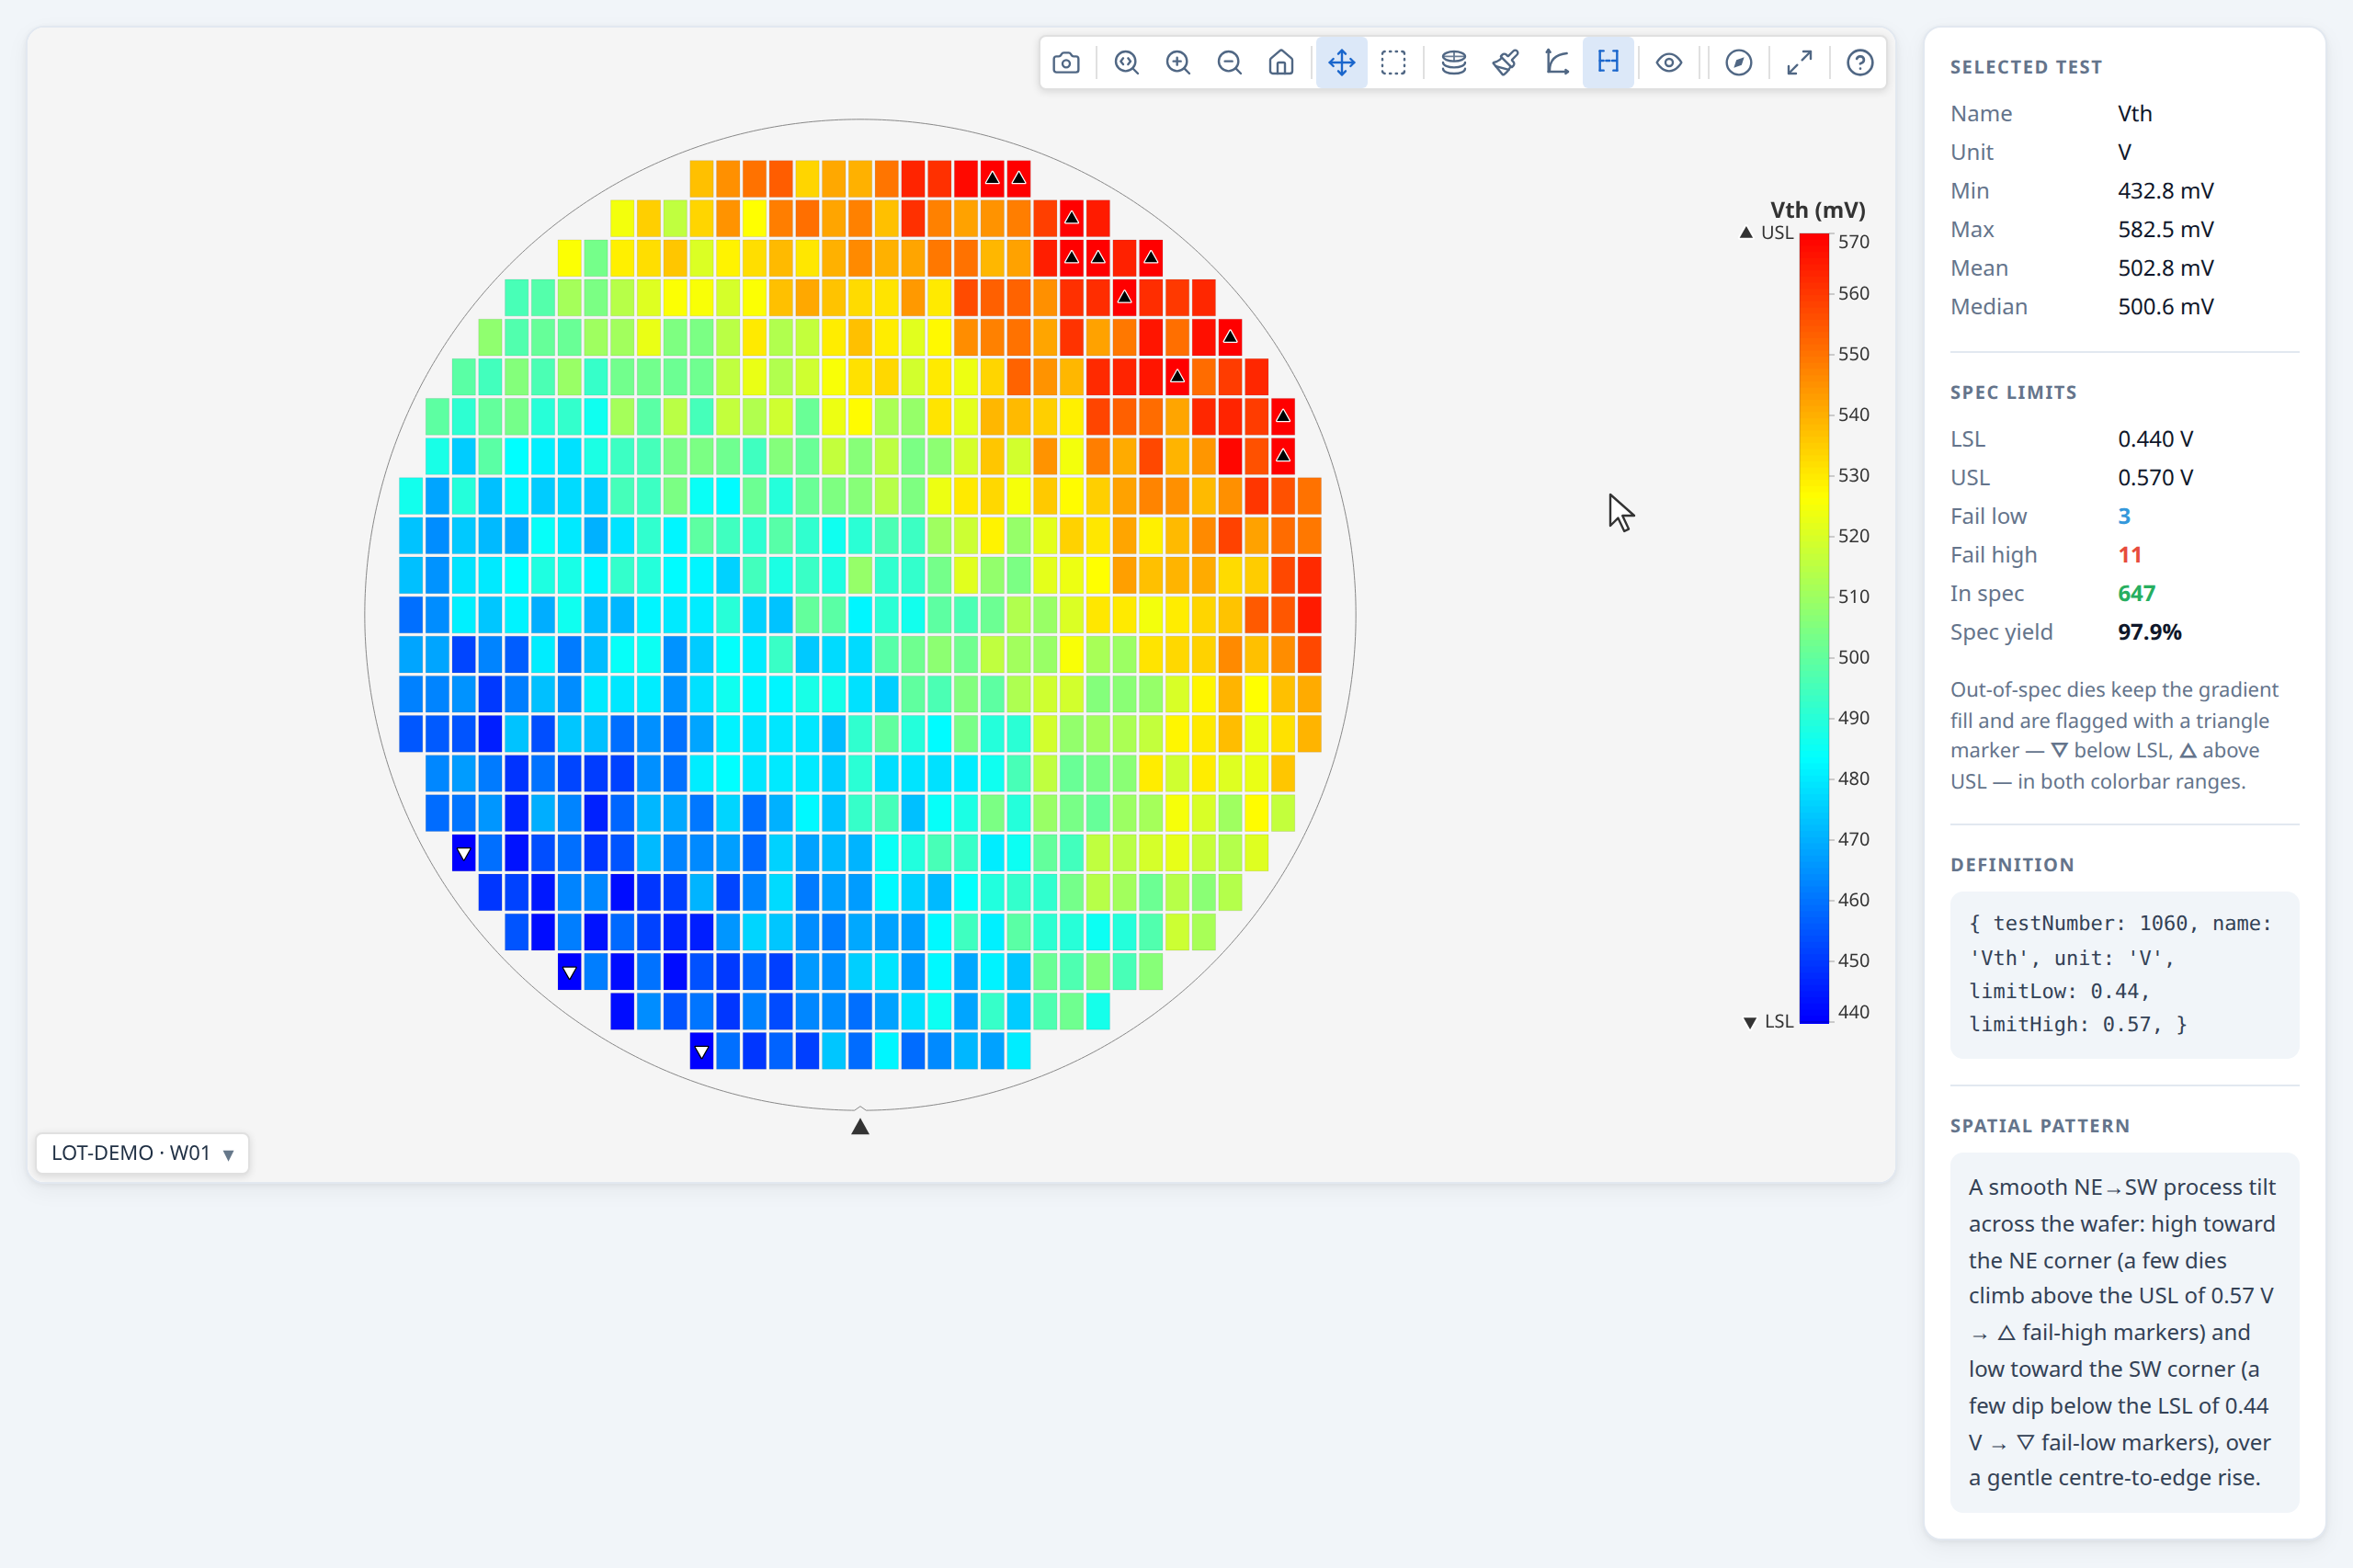
In both ranges, all dies are coloured by the gradient so the value distribution stays readable and the bar and die colours agree; dies outside the limits additionally carry a triangle marker — ▽ (below limitLow) / △ (above limitHigh), each tagged with a matching key beside the limit labels — so they remain flagged without dropping out of the distribution. The triangle is drawn black or white per die for contrast against its own gradient fill, so it stays visible under any colour scheme, and its shape (not colour) carries the below/above-limit meaning — readable even in greyscale or with colour-vision deficiency.
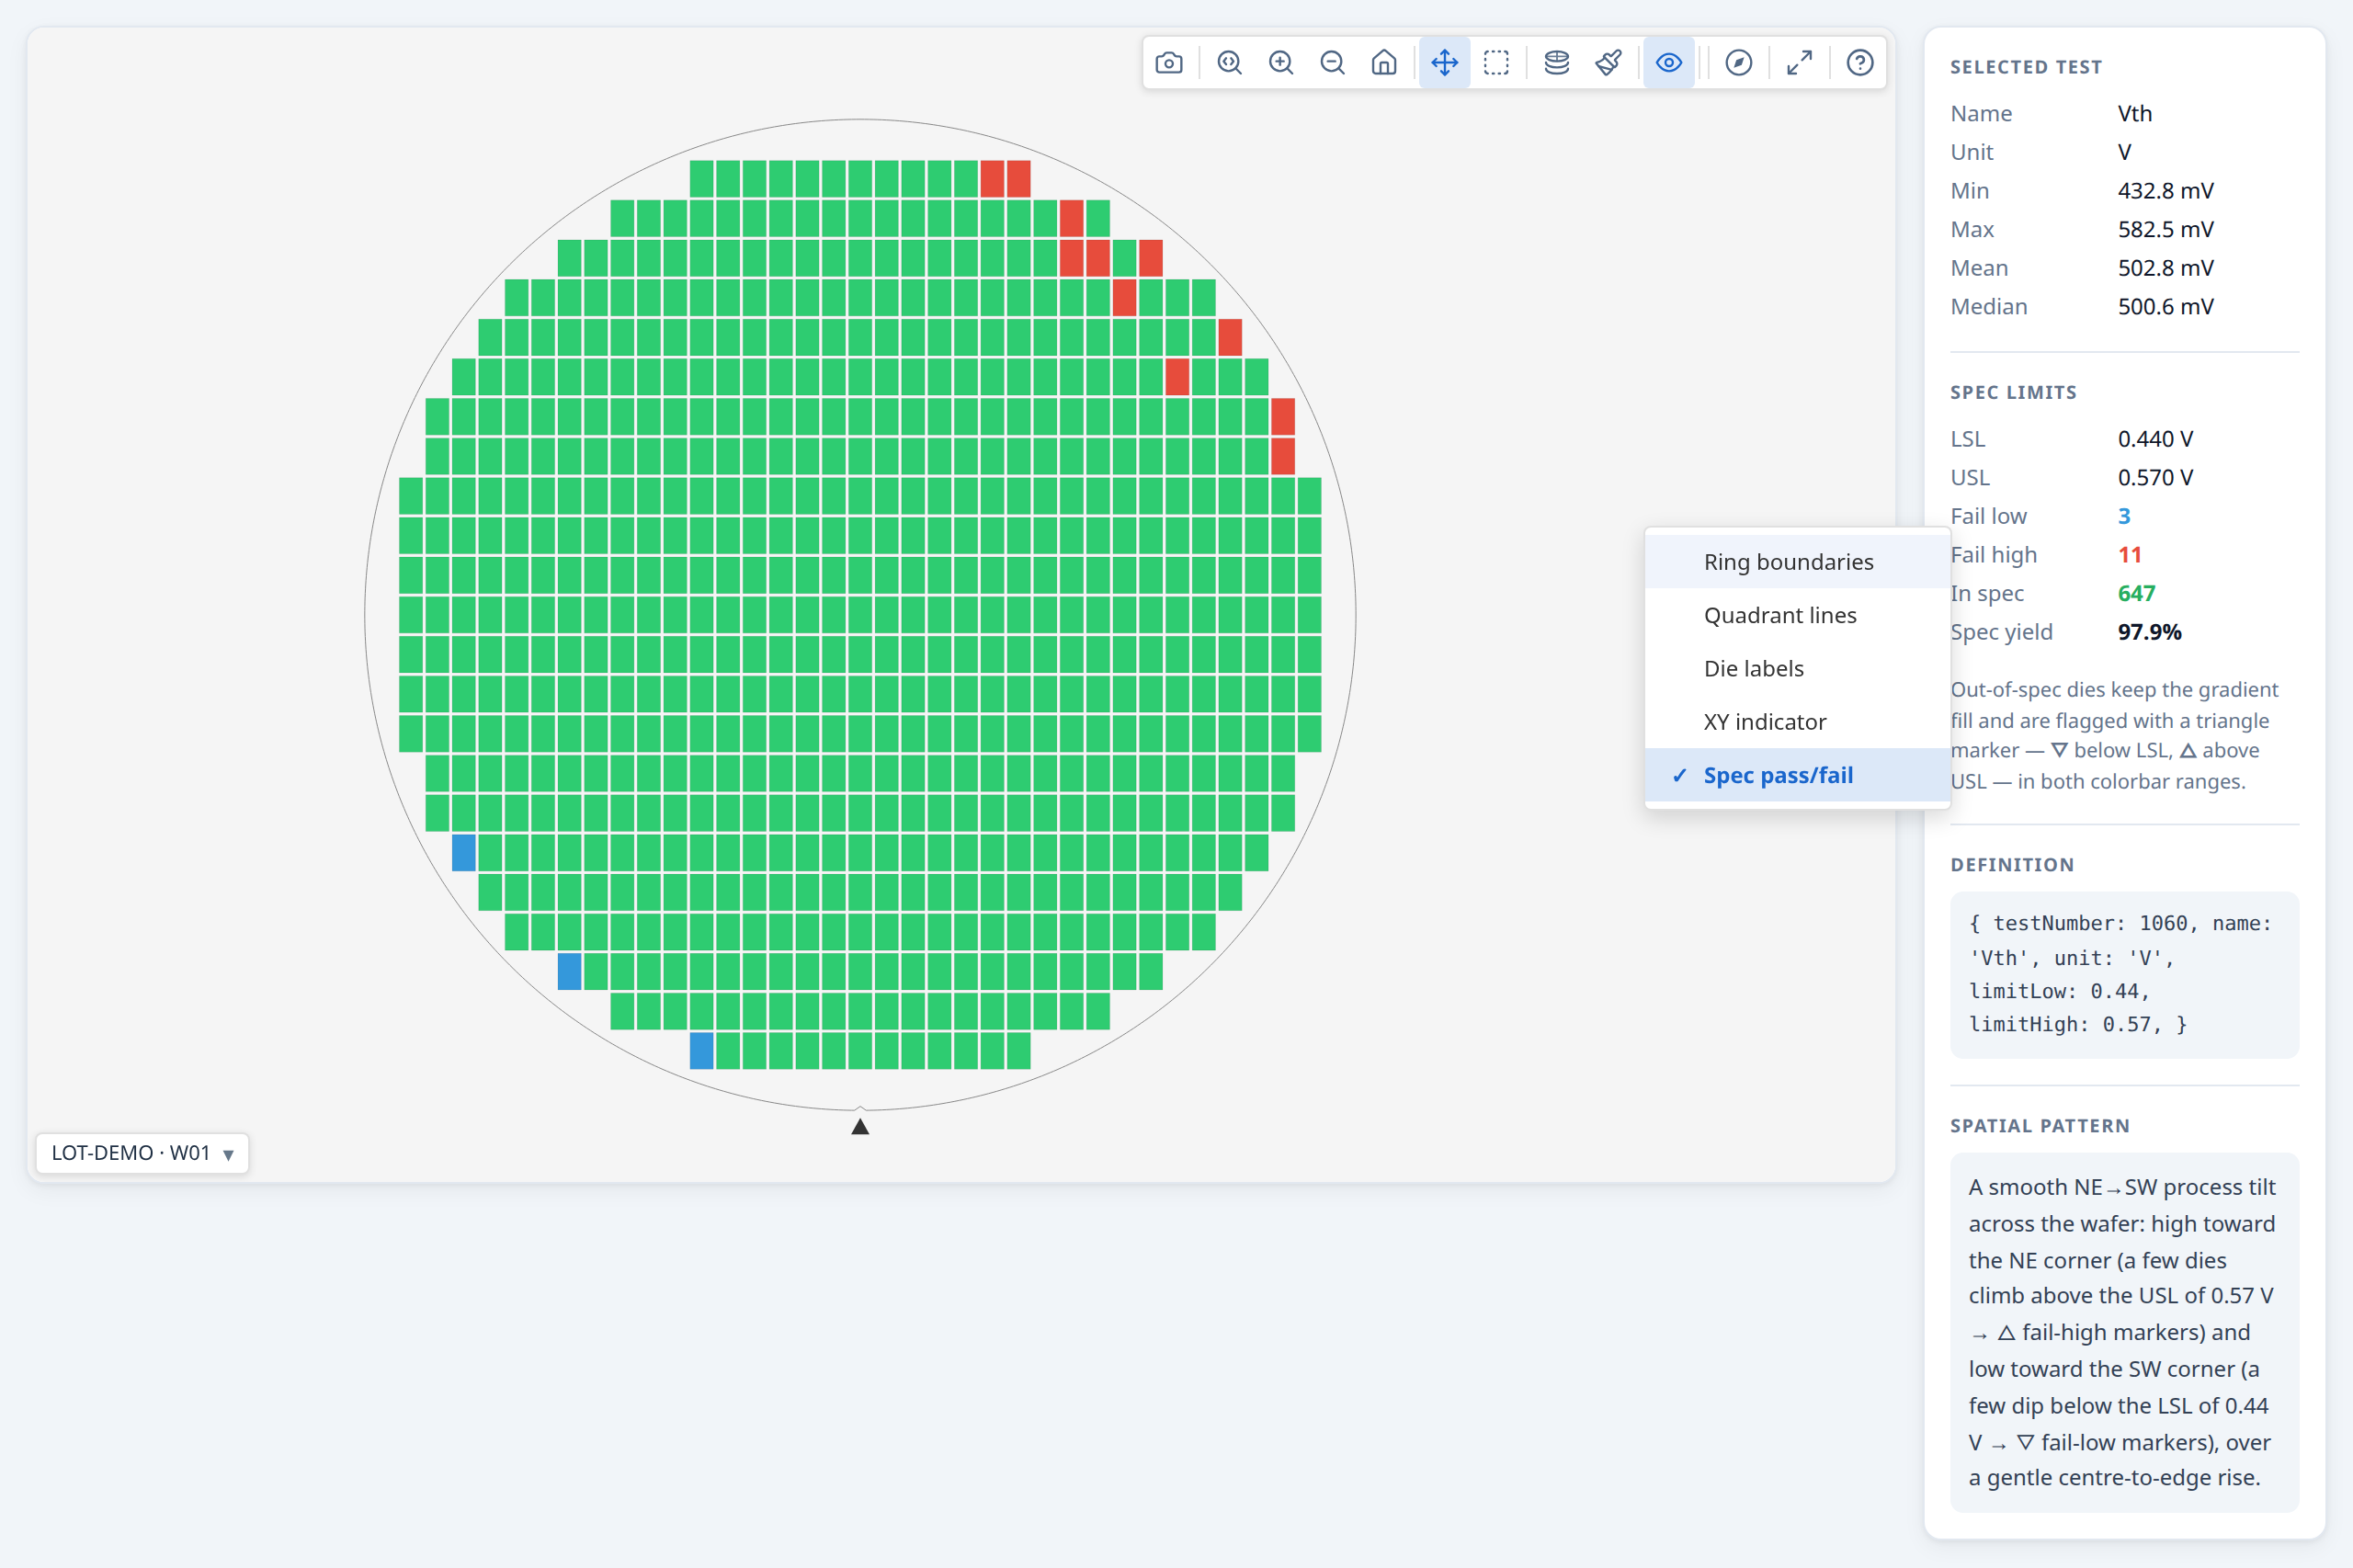
With passFailDisplay: 'spec' — a categorical pass/fail view instead of the continuous gradient, judged against the test limits:
- Pass (within limits): green (#2ecc71)
- Fail low (below the low limit): blue (#3498db)
- Fail high (above the high limit): red (#e74c3c)
- No data: grey
In this mode the colorbar is replaced by a Pass/Fail legend showing the categories that apply (Pass always; Fail high / Fail low only when the test defines that limit) with per-category die counts. The title reads {test} · #{number} above the legend and Limit pass/fail below it.
const testDefs = [
  { testNumber: 1050, name: 'Idsat', unit: 'A' },
  {
    testNumber: 1060, name: 'Vth', unit: 'V',
    limitLow:  0.44,  // low test limit — below this fails
    limitHigh: 0.57,  // high test limit — above this fails
  },
  { testNumber: 1070, name: 'Ioff', unit: 'A' },
];

const result = buildWaferMap({ results, waferConfig, dieConfig, testDefs });

// Enable pass/fail colouring for Vth to see spec status at a glance
renderWaferMap(container, result, {
  viewOptions: {
    plotMode:        'value',
    passFailDisplay: 'spec',
    activeTest:      1060,
    // testDefs inherited automatically from the result
  },
});
Spec limits also feed the stats engine: analyzeWaferMap populates summary.stats.testSpecYield with per-test spec yield, fail-low count, and fail-high count for every test that has at least one limit defined.
→ Demo: Working with test values
The same map with the view option 'Limit pass/fail' selected. Now the map shows the dies within the test limits in green and the dies out of limits in red, for the given test.
Functional tests (pass/fail only, no measured value)¶
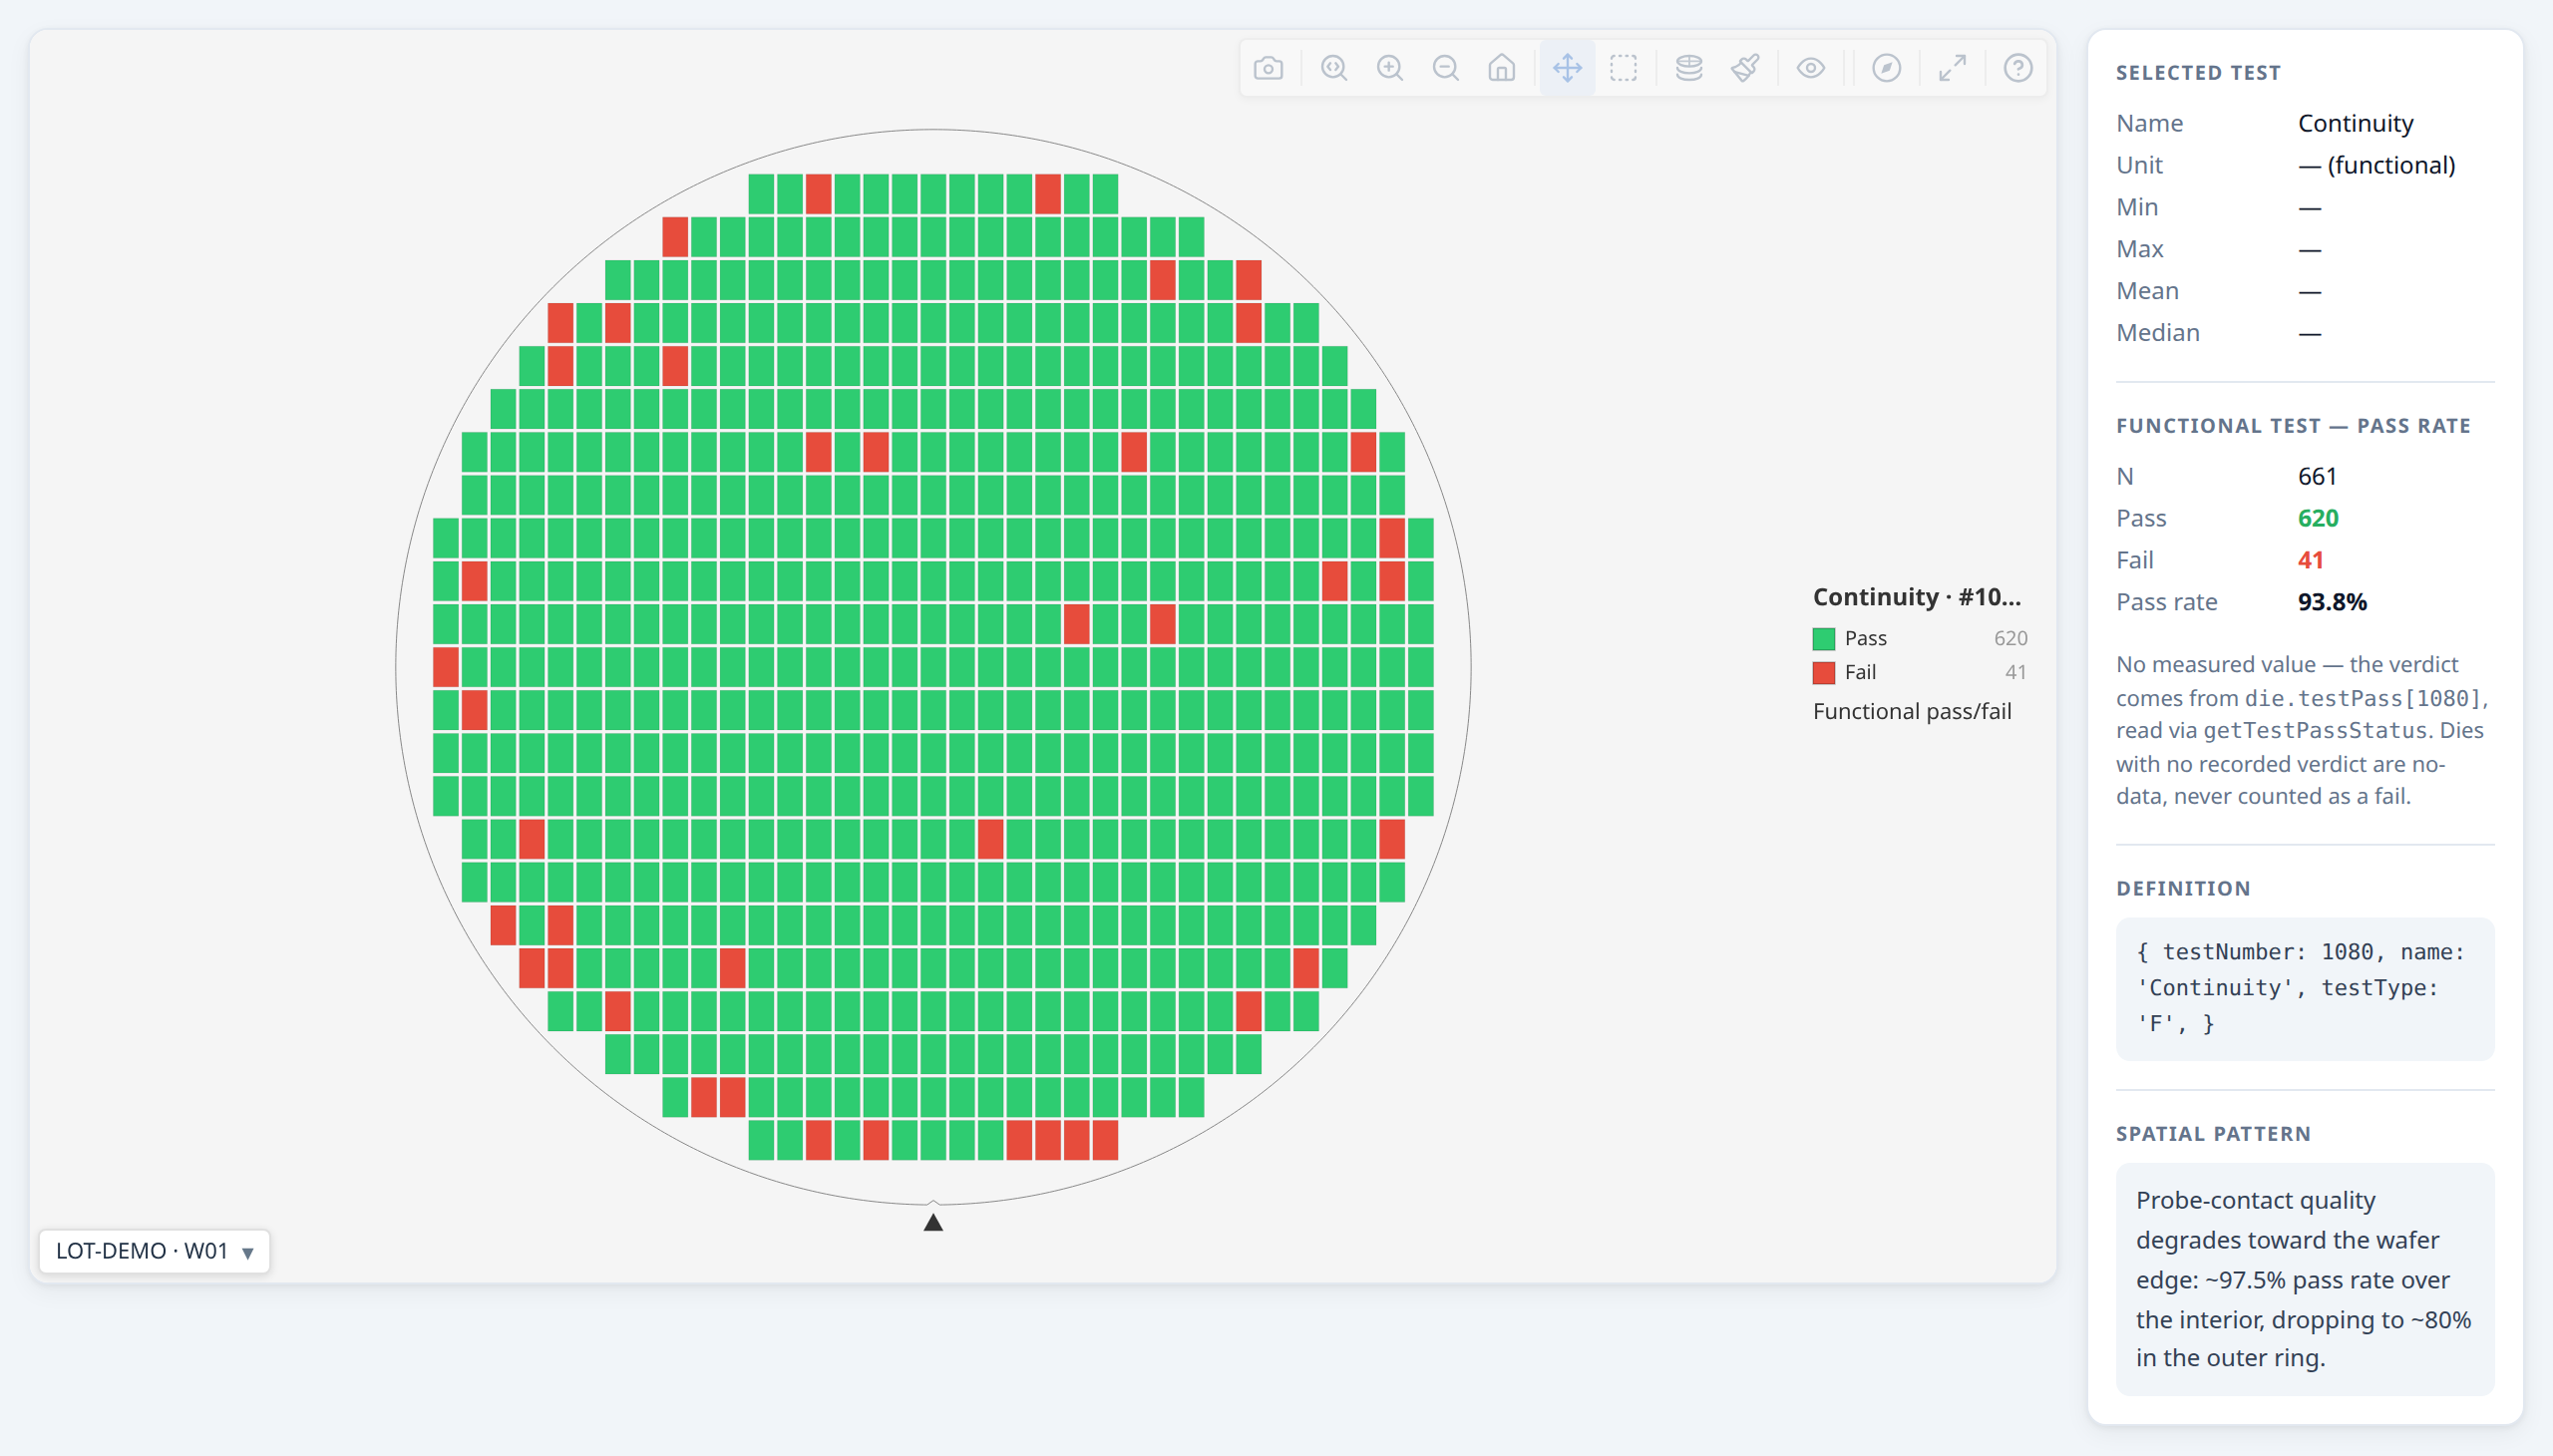
Not every test produces a number. A continuity check, a boundary-scan pass, or any go/no-go test has only an outcome — set testType: 'F' on that test's TestDef (default is 'P', parametric) and record the verdict on the die in testPass, keyed by testNumber the same way testValues is:
const testDefs = [
  { testNumber: 1050, name: 'Idsat', unit: 'A' },
  { testNumber: 1080, name: 'Continuity', testType: 'F' },  // no unit, no limits — verdict only
];

const results = [
  { x: 0, y: 0, hbin: 1, testValues: { 1050: 1.42e-3 }, testPass: { 1080: true } },
  { x: 1, y: 0, hbin: 2, testValues: { 1050: 1.38e-3 }, testPass: { 1080: false } },
  // ...
];

const result = buildWaferMap({ results, testDefs, passBins: [1] });
Selecting a functional test as the active test always renders as Test pass/fail (passFailDisplay: 'test') — coloured by the tester's recorded verdict from die.testPass, green pass / red fail, undirected (there is no "which side" the way spec limits have a high/low side). This is forced regardless of the requested display; a functional test has nothing to put on a gradient. The Overlays menu's "Test pass/fail" toggle is also available on a parametric test that happens to carry recorded verdicts (e.g. a tester-recorded PTR TEST_FLG), as an alternative to spec-limit judgement.
Functional tests are excluded from every parametric statistic — per-test stats, capability, correlation, distribution charts, value stacks, and regional value findings — since a mean or Cpk of a binary outcome is meaningless. They get their own pass-rate analysis instead: stats.functionalYield (one entry per functional test, with passDies/failDies/totalDies/passRatePercent), a Functional Tests table in the summary panel alongside — not replacing — the parametric Test values table, and regional pass-rate findings (kind: 'functionalTest').
Legacy encoding. If your data predates testPass and encodes a functional outcome as a testValues entry of 1 (pass) / 0 (fail), that keeps working — getTestPassStatus(die, testNumber, testDef) is the single read-path for verdicts everywhere in the library (rendering, stats, findings) and falls back to that encoding for a functional test with no testPass entry. New code should write testPass and leave functional tests out of testValues entirely.
Working with metadata¶
Metadata is anything describing a wafer or die beyond its test results: the lot and test program a wafer came from, or the project a die belongs to on a multiproject wafer. It shows in the identity header, tooltips and die-list exports, and can colour the map itself.
Wafer vs. per-die metadata¶
Lot- and wafer-level facts — lot, product, test program, temperature, test date — belong on WaferMetadata, passed once via waferConfig.metadata. A die cannot differ from its wafer on these, so they live on the wafer and the tooltip reads them from there:
const result = buildWaferMap({
  results: rows.map(r => ({ x: Number(r.x), y: Number(r.y), hbin: Number(r.hbin) })),
  waferConfig: {
    metadata: { lot: 'LOT-001', product: 'NMOS-A', testProgram: 'NM_v3.2', temperature: 25 },
  },
  dieConfig: { width: 10, height: 10 },
});
Use the metadata field on a DieResult only for data that genuinely varies die-to-die — any key is accepted via the open index signature and shown in the tooltip:
results: rows.map(r => ({
  x: Number(r.x), y: Number(r.y), hbin: Number(r.hbin),
  metadata: { probeCard: r.probe_card, inkDate: r.ink_date },
})),
Metadata appears automatically in hover tooltips — no extra configuration. The tooltip merges the wafer's WaferMetadata (base) with the die's DieMetadata; a per-die key overrides the wafer value of the same name. null/undefined values are skipped. wmap renders whatever keys you supply, so you control tooltip content through the metadata you set.
Metadata also reaches the die-list table and its CSV export (API §5.4.4) — not only the tooltip. Die metadata is on by default, one column per key; wafer metadata is CSV-only by default, since it's constant down every row (screen noise) but exactly what makes a detached CSV self-describing enough to concatenate several wafers' exports and still know which wafer each row came from. Column labels use metadataFields[].label when declared, else a Title-Cased version of the key, matching the tooltip's own labels.
Changed in 0.15.0: wafer-level fields (
lotId,waferId,deviceType,testProgram,temperature) were removed fromDieMetadata— set them onWaferMetadatainstead. See the migration note in the changelog.
Read metadata back from the die in any callback:
renderWaferMap(container, result, {
  onClick: (die) => {
    console.log(die.metadata?.lotId);      // named field
    console.log(die.metadata?.probeCard);  // custom field
  },
});
Wafer-level metadata¶
Custom fields work the same way on waferConfig.metadata (WaferMetadata → §12.3). They appear in the summary panel header alongside the named fields:
const result = buildWaferMap({
  results: rows.map(r => ({ x: Number(r.x), y: Number(r.y), hbin: Number(r.hbin) })),
  dieConfig: { width: 10, height: 10 },
  waferConfig: {
    metadata: {
      lot:      'LOT123',
      waferId:  1,
      testDate: '2026-04-23',
      // custom fields — shown in summary panel header
      equipmentId: 'P-01',
      recipe:      'NMOS-R2',
    },
  },
});
Metadata / layout plot mode¶
Sometimes a grid position represents a classification rather than a test result —
which project a die belongs to on a multiproject wafer, vendor/third-party
ownership, or reserved/shared area. Mapping that onto hard bins borrows
pass/fail-flavoured colours and "Hard Bin" terminology for data that isn't a bin
at all. The 'metadata' plot mode is a generic alternative: it colours and
legends the map from whatever key you already have in die.metadata, no new
per-die field required.
Opting a field in¶
A key is only offered in the toolbar's mode menu once it's listed in
metadataFields — never auto-detected:
const result = buildWaferMap({
  results: [
    { x: 4, y: -2, hbin: 1, metadata: { project: 'our-project' } },
    { x: 5, y: -2, metadata: { project: 'vendor' } }, // vendor die — no test data at all
  ],
  metadataFields: [
    { key: 'project', label: 'Project', values: [
      { value: 'our-project', color: '#4e79a7' },
      { value: 'vendor',      label: 'Third-party vendor', color: '#bab0ac' },
    ] },
  ],
});

renderWaferMap(container, result, {
  viewOptions: { plotMode: 'metadata', activeMetadataKey: 'project' },
});
values is optional per field — distinct values with no override are still
shown, auto-labelled with the raw value and auto-coloured from an ordered
palette (assigned in natural alphanumeric order — D0, D1, D2, D10, not the
lexicographic D0, D1, D10, D2 — so colours are stable across reloads and the
legend reads in the order an engineer expects).
Coexists with test/bin data¶
A die can carry hbin/testValues and a metadata classification at the same
time — 'metadata' is just another selectable toolbar view of the same die,
the way hardBin/softBin/value already are. die.metadata already renders
in every tooltip regardless of plot mode, so switching into 'metadata' mode
changes the map's colour/legend without changing what the tooltip shows.
Click-to-highlight in the legend¶
Clicking a legend swatch dims every other value, exactly like hardBin/
softBin — click the same swatch again to clear it. This is
highlightMetadataValue, the string-keyed analogue of highlightBin:
renderWaferMap(container, result, {
  viewOptions: { plotMode: 'metadata', activeMetadataKey: 'project', highlightMetadataValue: 'vendor' },
});
What's deliberately absent¶
- No lot-stacking. A die's layout classification is a constant of the
design, not a per-wafer measurement — there's nothing meaningful to
aggregate across a lot, so
'metadata'has nostackedXcounterpart. - No colour-scheme picker. The palette control is hidden in this mode —
colouring always uses the dedicated ordered palette plus
values[].coloroverrides, never the built-in schemes. - Never affects yield.
die.metadatawas never part of the yield-eligibility pipeline, so a die's yield/pass-fail status (if it has one) is entirely unaffected by its metadata classification.
Selection, zoom, and PNG export need no special handling — none of them are plot-mode-aware.
→ Demo: Metadata / layout plot mode
Retests and enriching dies after build¶
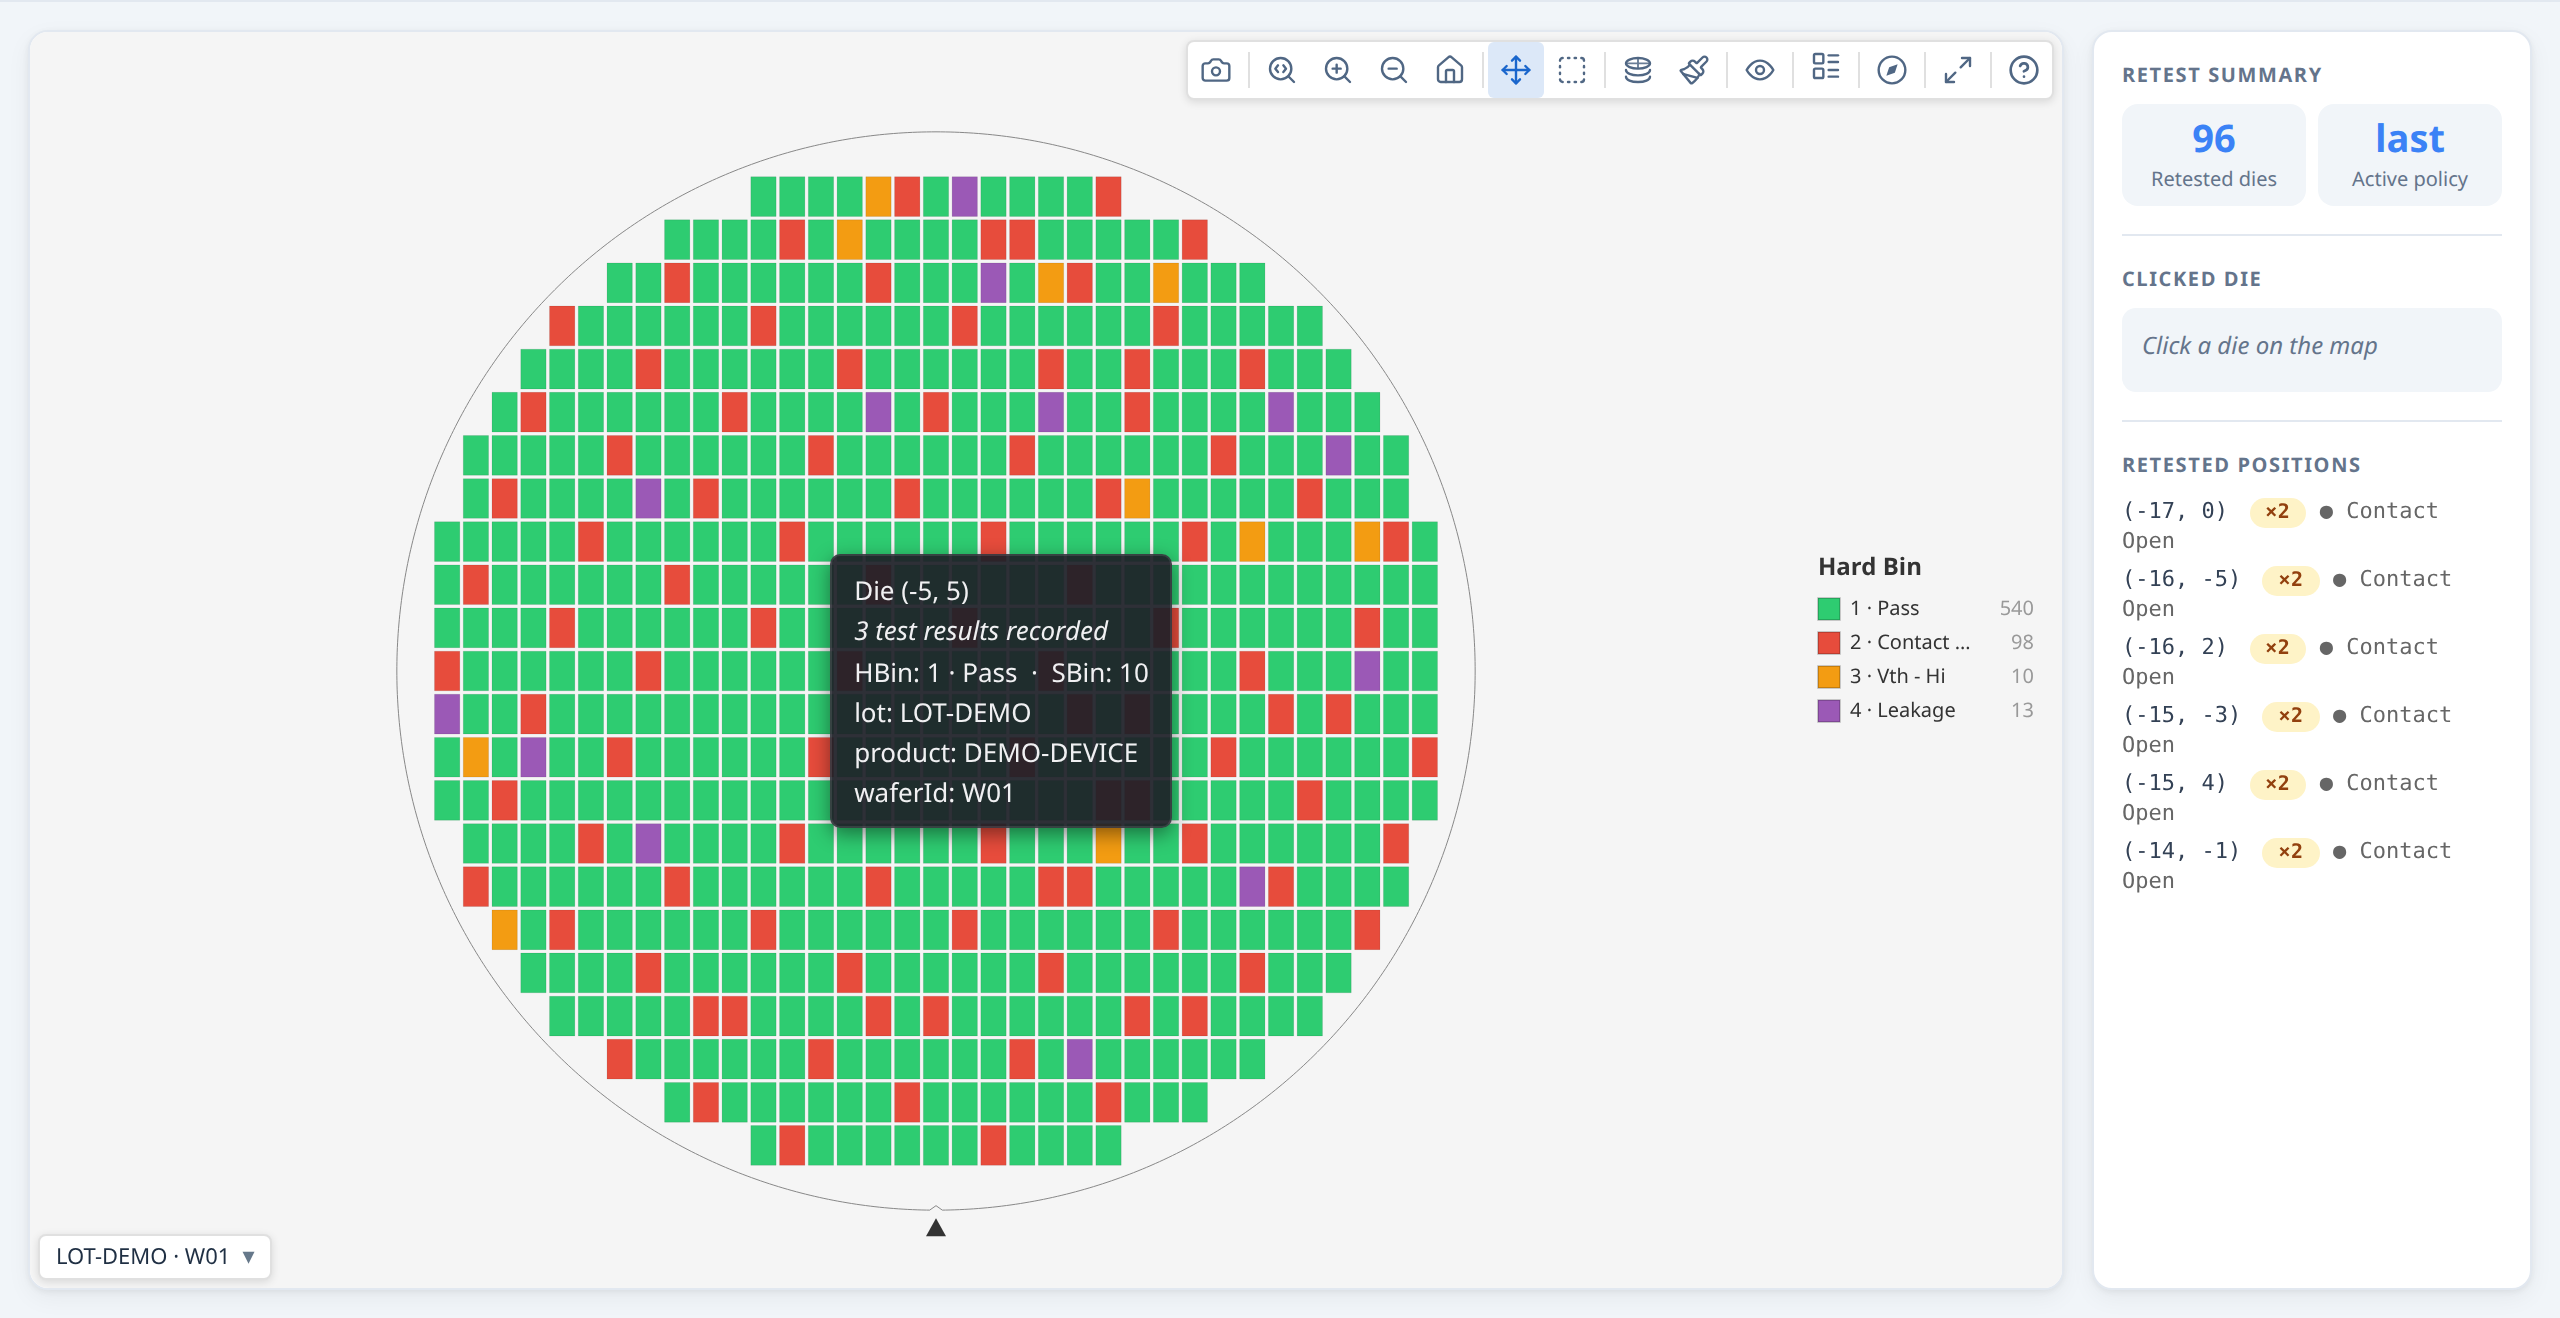
Handling retests¶
If your data includes multiple probe results for the same die position (retests), the library handles them automatically. Four policies are available:
| Policy | Behaviour |
|---|---|
'last' (default) |
Keep the most recent result per position |
'first' |
Keep the earliest result per position |
'best' |
Keep the best result using passBins as the primary criterion: a pass always beats a fail. Within the same pass/fail category, lower hbin number wins. Falls back to 'last' when candidates have no hbin. |
'worst' |
Keep the worst result: a fail always beats a pass. Within the same category, higher hbin number wins. Falls back to 'last' when candidates have no hbin. |
const result = buildWaferMap({
  results:      rawResults,  // may contain the same (x,y) more than once
  retestPolicy: 'best',      // keep the best bin result per position
});

// Check which dies were retested:
result.dies.filter(d => d.retestCount !== undefined)
           .forEach(d => console.log(`(${d.x},${d.y}) retested ${d.retestCount}×`));
Retested dies automatically show "Retests: N" in their hover tooltip. retestCount is only set on dies that appeared more than once in the input — non-retested dies have retestCount === undefined.
Post-enrichment (attaching extra values after the map is built)¶
Sometimes you need to attach data that isn't in the same table as the grid positions — for example, merging test values from a separate parametric table into a map already built from a bin summary:
import { buildWaferMap, getDieKey } from '@wafertools/wafermap';

// Step 1: build the map from the bin data
const result = buildWaferMap({ results: binRows.map(r => ({
  x: Number(r.x), y: Number(r.y), hbin: Number(r.hbin),
})), dieConfig: { width: 10, height: 10 } });

// Step 2: build a lookup from the parametric table
const paramMap = new Map(paramRows.map(r => [getDieKey({ x: Number(r.x), y: Number(r.y) }), r]));

// Step 3: enrich dies in place
const enrichedDies = result.dies.map(die => {
  const row = paramMap.get(getDieKey(die));
  if (!row) return die;
  return { ...die, testValues: { 1050: Number(row.idsat), 1060: Number(row.vth) } };
});

// testDefs must be on the result so the stats engine and tooltips can read them
const testDefs = [
  { testNumber: 1050, name: 'Idsat', unit: 'A' },
  { testNumber: 1060, name: 'Vth',   unit: 'V' },
];

renderWaferMap(container, { ...result, dies: enrichedDies, testDefs });
Always use
getDieKey(die)for lookups rather than manually formatting"${die.x},${die.y}"— it guarantees the correct format after any grid offset correction.
→ Demo: Working with retested dies