wafermap
A JavaScript library for rendering interactive wafer maps from semiconductor test data. Hard bins, soft bins, test values, retest runs, edge exclusion, and spec limits are native inputs — no pre-processing required.
import { buildWaferMap } from '@wafertools/wafermap';
import { renderWaferMap } from '@wafertools/wafermap/render';

const result = buildWaferMap({ results });
renderWaferMap(document.getElementById('map'), result);
Which docs are for you?
Just want to open a wafer map file? You may not need to build anything. tsmap is a finished, free, MIT-licensed application built on this library — it opens STDF, ATDF, CSV, JSON and Parquet (plus .gz and .zip), runs on Linux, macOS and Windows, and also runs in your browser with no install and no upload: files are parsed locally and never leave your machine.
It gives you everything on this page's screenshots — plot modes, the findings panel, the Insights chart suite, lot galleries, splits, reports — without writing any code. Build on the library instead when you need wafer maps inside your own application, a data source tsmap doesn't read, or behaviour it doesn't offer. Otherwise start with tsmap; you can always integrate later, and its user guide is the same one shipped in-app.
Building an application with wafermap? You're a developer integrating the library into a test-data app. Follow this path:
- Quick Start — a working map in 5 minutes
- Developer Guide — walkthroughs from first map to lot gallery with findings
- SvelteKit · React · Vue 3 — wiring it into your framework
- API Reference — every type, option, and return value
Using an application built on wafermap? You're a test, device, or yield engineer reading wafer maps in an app someone built with this library — tsmap, or one of your own team's. You need exactly one page:
- Application User Guide — reading the map, plot modes, toolbar, findings, Insights tab
- Glossary — if a term on screen is unfamiliar
Evaluating the library? Judge it quickly:
- Download the examples package — every example plus the bundled library, running on your own machine in about a minute. No npm, no network.
- Showcase — all features on one page
- wafermap vs Plotly.js — side-by-side timings and features
- Performance — measured cost by wafer size and option
- Detection Analysis — benchmark validation of the pattern-detection systems
Find a task
| I want to… | Read |
|---|---|
| Render my first map | Quick Start |
| Load real CSV data | Guide: Loading real data from a CSV |
| Show bins, yield, and pass/fail colours | Guide: Working with bins |
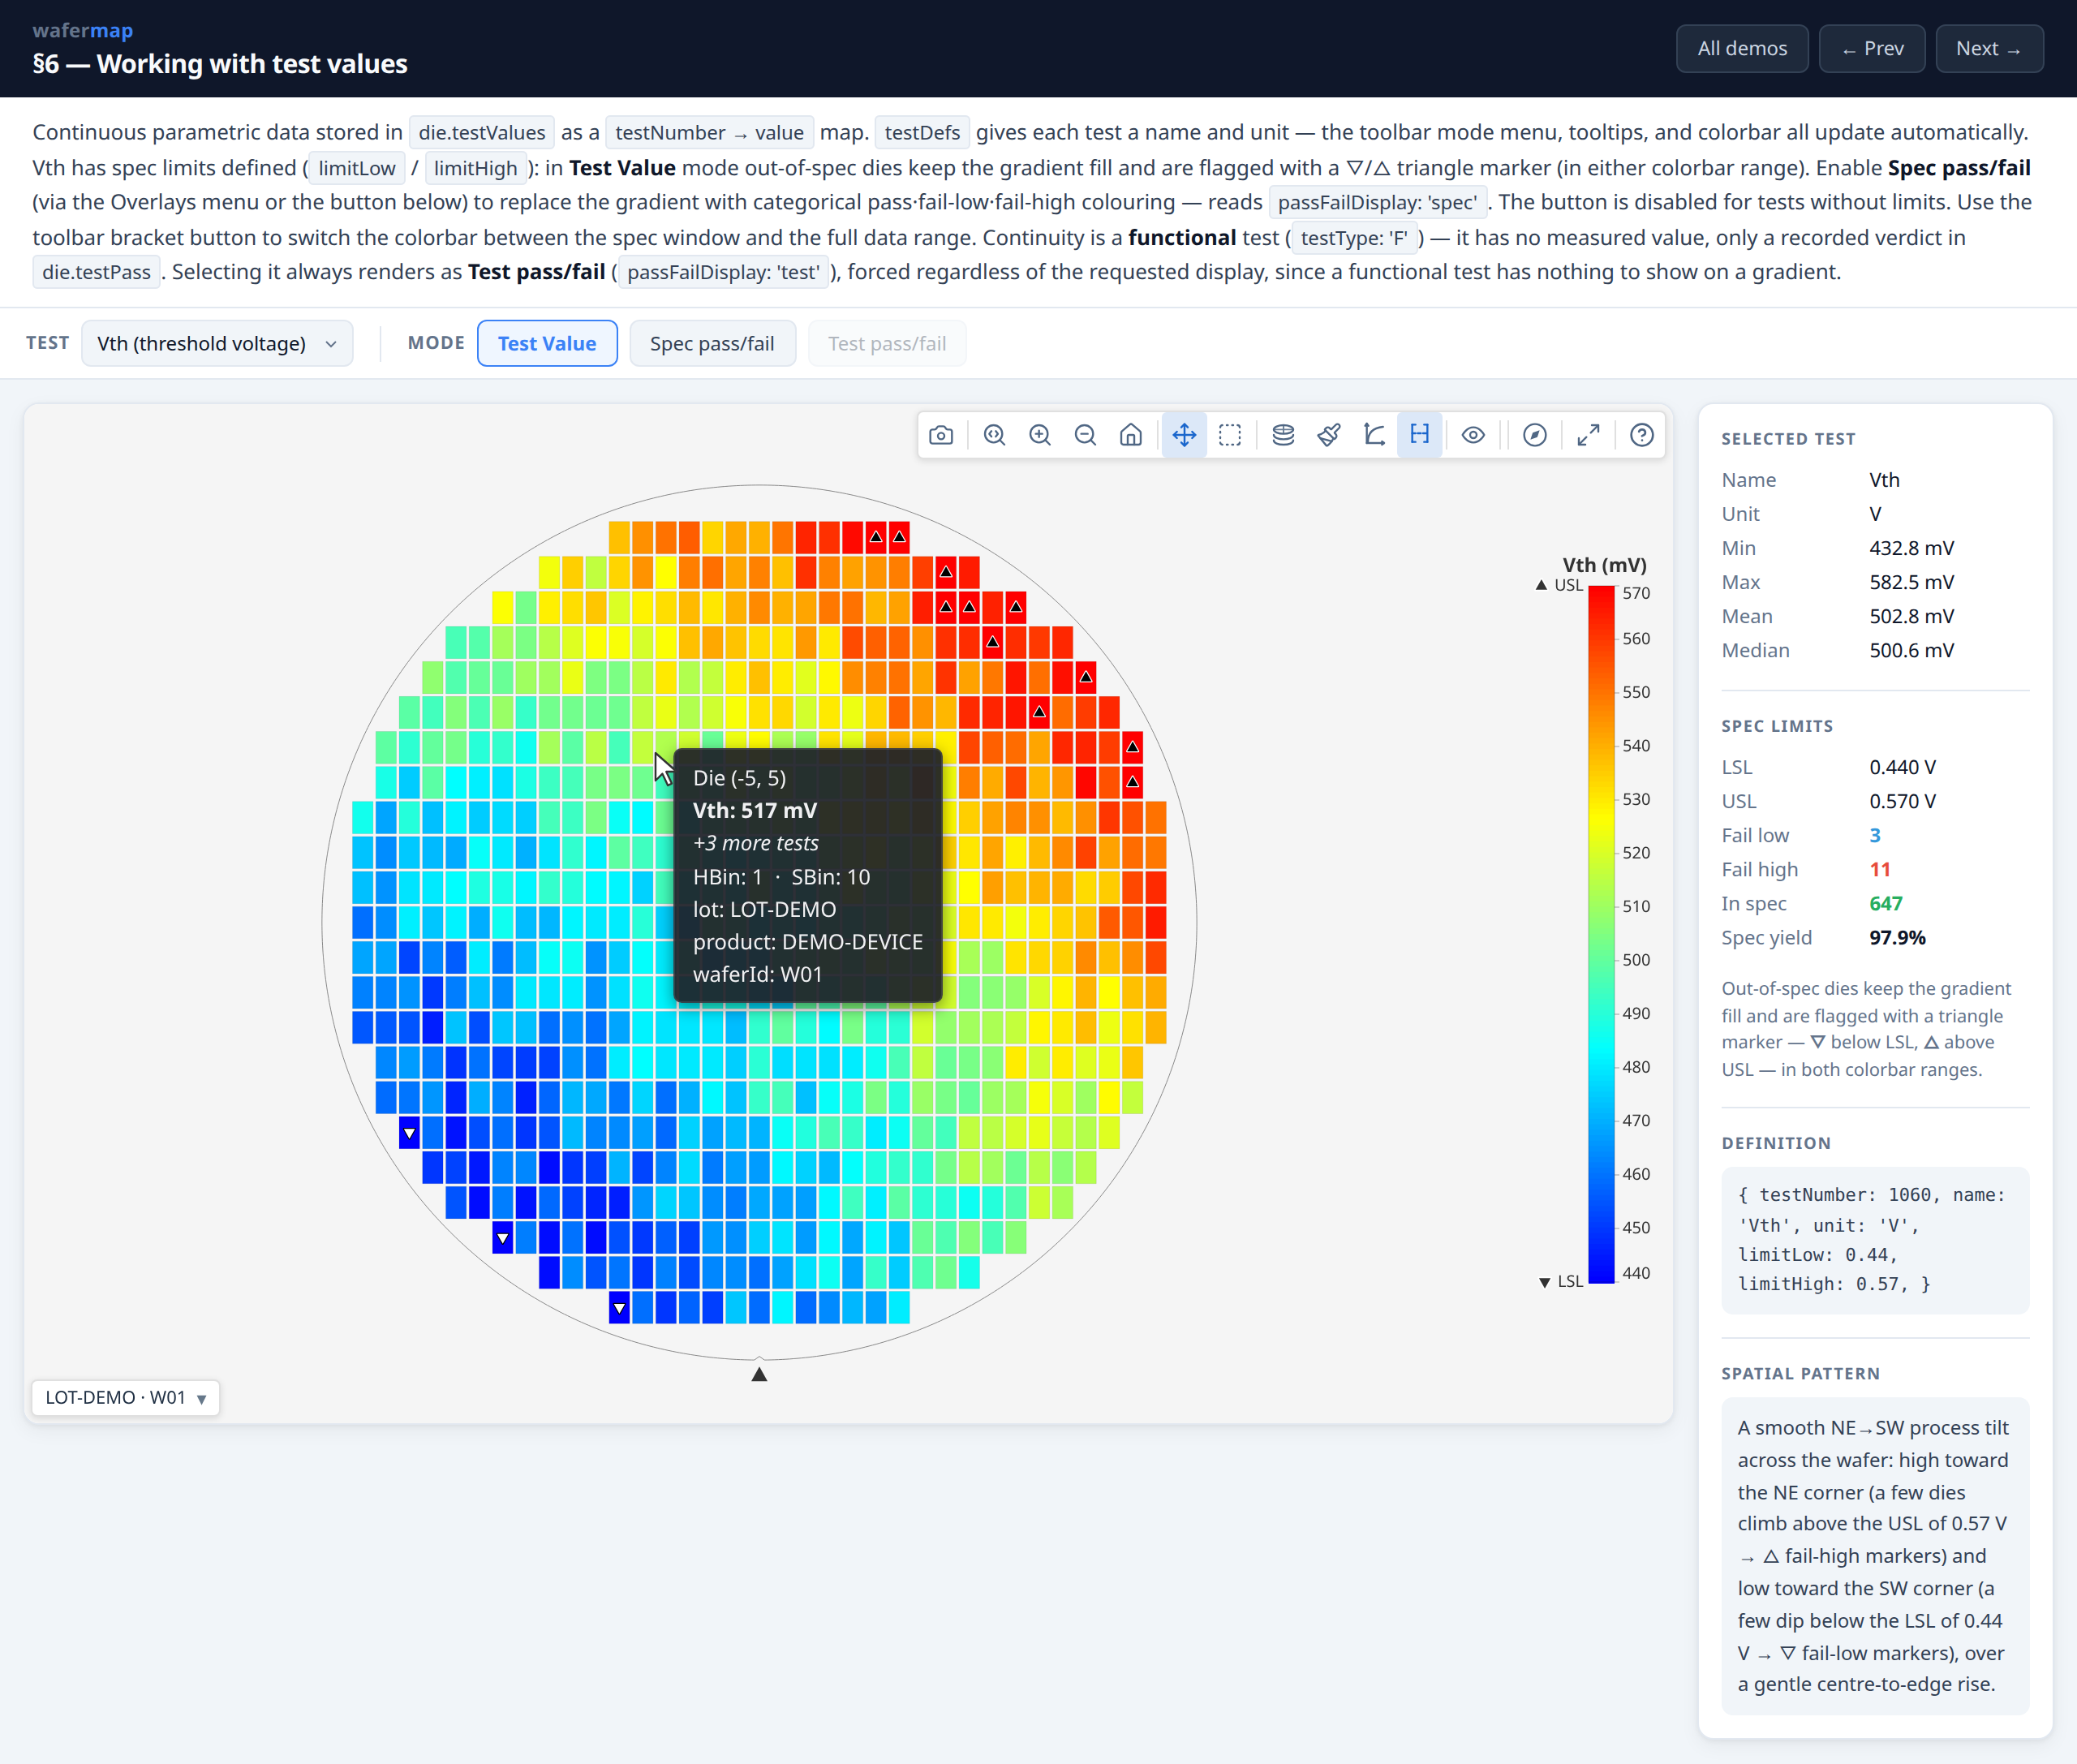
| Plot parametric test values with spec limits | Guide: Working with test values |
| Handle retests | Guide: Retests and enriching dies after build |
| React to hover, click, and die selection | Guide: Responding to user interaction |
| Add statistical findings / pattern detection | Guide: Adding statistical findings · Pattern Detection |
| Show a whole lot as a gallery | Guide: Building a lot gallery |
| Add the Insights chart suite | Guide: The Insights tab |
| Keep the UI responsive on big lots | Guide: Processing large datasets with a Web Worker · Performance |
| Use it in React / Vue / SvelteKit | React · Vue 3 · SvelteKit |
| Fix a blank map or wrong yield | Troubleshooting |
| Understand the package layers | Architecture |
What it covers
Geometry. Pass full physical dimensions or raw prober step positions — die pitch, wafer diameter, and coordinate origin are inferred when not supplied. Retest policy (last, first, best, worst), edge exclusion, and reticle overlays are supported directly.
Rendering. renderWaferMap produces an interactive canvas map with toolbar, zoom/pan, tooltips, die selection, and summary panel. renderWaferGallery renders a full lot as a responsive card grid with shared controls and click-to-expand.
Analysis. analyzeWaferMap runs spatial analysis across rings, quadrants, sectors, and reticle positions, and detects contiguous failure clusters and edge arcs. analyzeWaferLot adds lot-level trend series and cross-wafer patterns. Results wire directly into the summary panel.
Integration. Pure ES modules, no server, no runtime dependencies. Works in React, Svelte, Vue, plain HTML, or a Web Worker.
Who wrote this, and why
Written by Paul Robins, after nearly four decades in semiconductor test — most of it building test data analysis tools: wafer map and chart viewers, and the platforms they were built on.
That work leaned on free software throughout — zlib, Tcl/Tk, SQLite, GCC — and it was a good deal. wafermap is some of it going back the other way, prompted by finding out that engineers doing this job today still have no decent free option for wafer map analysis.
MIT licensed: free to use, modify and redistribute, including in commercial and closed-source products. The only condition is that the copyright notice travels with it.
Community
Questions, ideas, or want to show off a wafer map you built? Use GitHub Discussions.